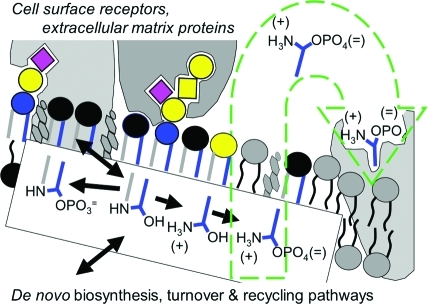
Figure 3.
Schematic representation of sphingolipid functions. This diagram depicts a hypothetical plasma membrane with representative categories of sphingolipids with the black headgroup representing sphingomyelin, the colored headgroups the glycosphingolipids as in Figure 1, and the lipid backbones with the sphingoid base in blue and the amide-linked fatty acid in gray; phosphoglycerolipids and cholesterol are depicted in gray. The diagram illustrates the clustering of a portion of the sphingolipids (and cholesterol) in membrane “rafts,” the binding of ganglioside GM3 (left) and GM1 (right) to proteins, and the metabolic interconversions of some of the sphingolipids (shown in the box, in the order ceramide 1-phosphate, ceramide, sphingosine, and sphingosine 1-phosphate, S1P), which alters both the biophysical properties of the membrane and generates signaling molecules, such as S1P, which is involved in both intracellular signaling and extracellular signaling (represented by the green arrow).

