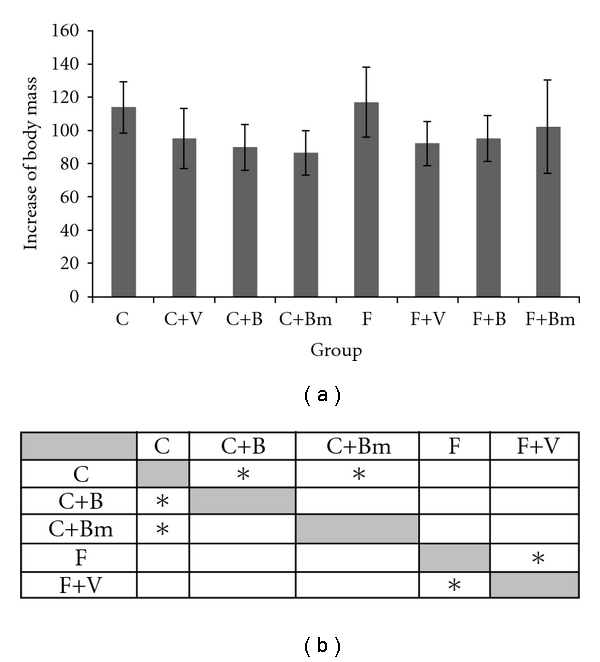
Figure 1.

Values of animal weight changes of animals fed with a standard diet and high fatty diet (P ≤ 0.2005) with the addition of vanadium complexes tested. Data presented as mean ± SD for n = 6. (b) Statistical differences between groups P < 0.05.
