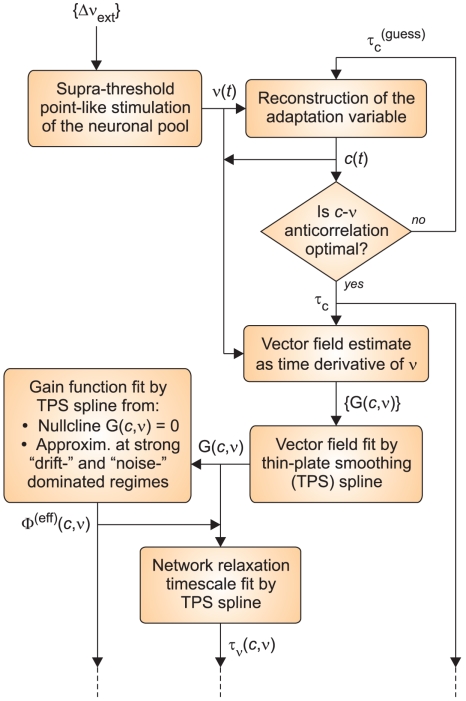
Figure 2.
Flow chart of the identification algorithm. The procedure starts (top left corner) with the stimulation of the neuronal network through the protocol ({Δνext}) described in the Section 2. From the resulting instantaneous firing rate ν(t), the time course of the adaptation dynamics c(t) is carried out for different guess values of τc. The estimated τc is satisfying an optimality criterium based on the anti-correlation between c and ν. The trajectories (c(t),ν(t)) are then employed in the generation of the fitting data for the vector field component of interest ({G(c,ν)} on the phase plane). These sparsely distributed values are subsequently interpolated using a thin-plate smoothing spline. The resulting function G(c,ν) defined over the whole phase plane, together with various reference values and a fitting model for Φ(eff), allow to reconstruct both the effective gain function Φ(eff)(c,ν) and the network relaxation timescale τν(c,ν).

