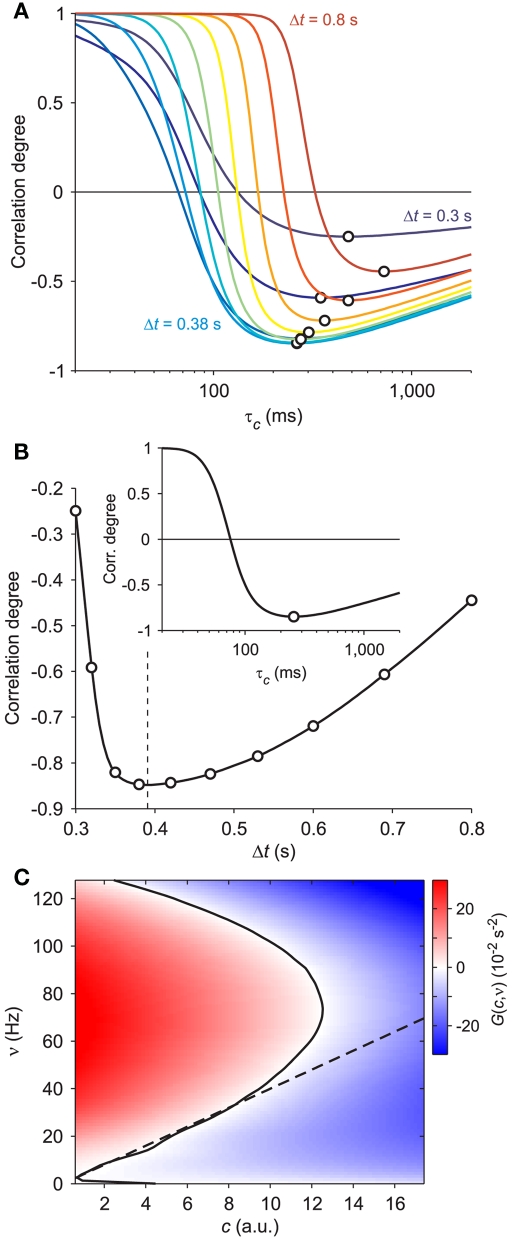
Figure 3.
Optimal adaptation timescale and vector field estimate. (A) Dependence on τc of the correlation degree between average ν(t) and c(t) in the 100 ms periods at fixed time lag Δt from the beginning of reconstructed trajectories. Each curve correspond to a different Δt in the range [0.3, 0.8] s color coded from blue to red, respectively. Circles point out the maximum anti-correlation for each Δt. (B) Maximum anti-correlation versus Δt. Circles are the same as in (A) The dashed line at Δt = 0.391 s marks the minimum correlation degree. Inset: correlation degree versus τc for the optimal Δt. A circle marks the minimum at the optimal τc = 257 ms. (C) Estimated G(c,ν) in the phase plane (c,ν) setting τc to its optimal value: solid curve, nullcline ; dashed line, nullcline . Simulated network parameters as in Figure 1.

