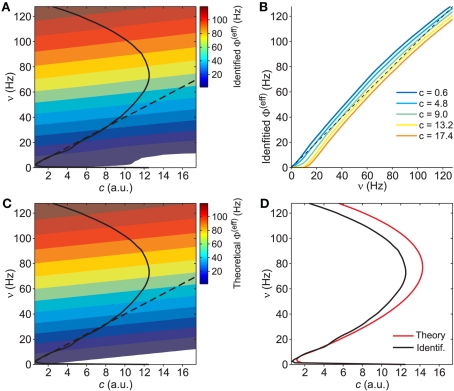
Figure 5.
Identification of the gain function Φ(eff). (A) Contour plot of the identified gain function Φ(eff)(c,ν) starting from the reference values extracted in Figure 4 (white region, Φ(eff) < 0.5 Hz). Solid and dashed black curves, the same nullclines of the vector field as in Figures 3 and 4. (B) Identified Φ(eff) sections at different c (see inset for color code). Black dashed line, Φ(eff) = ν. (C) Contour plot of Φ(eff) from mean-field theory for model parameters as in Figure 1 (white region, Φ(eff) < 0.5 Hz). Black curves as in (A). (D) Theoretical nullcline Φ(eff) = ν (red) versus the one from the identified G(c,ν) black, the same as in (A,C).

