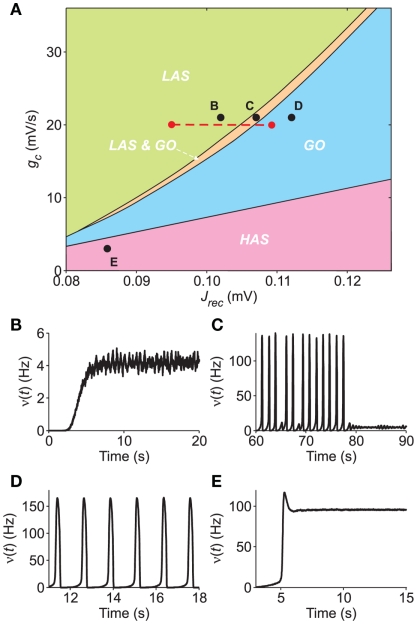
Figure 7.
Bifurcation diagram of a simulated network of excitatory LIF neurons. (A) Section of the bifurcation diagram in the plane (Jrec,gc) displaying the different dynamical regimes observed in the simulations: LAS, single attractor low-firing asynchronous state (green); LAS & GO, coexistence of LAS and a metastable limit cycle where the network shows global oscillations (orange); GO, only periodic population bursts occur; HAS, single attractor high-firing asynchronous state. Red dashed line, region explored in Figure 8. (B–E) Examples of population activity from simulations in the different dynamical regimes of the bifurcation diagram [see respectively labeled black dots in (A)]. Simulated networks are composed of 20,000 excitatory LIF neurons.

