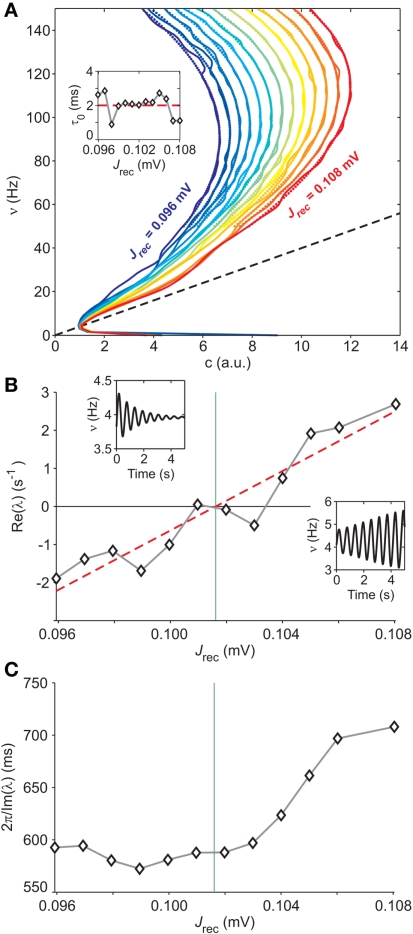
Figure 8.
Extracting microscopic features from mesoscopic identification. (A) Nullclines of the identified field component G from LIF network simulations at different levels of recurrent synaptic excitation Jrec, spanning the red dashed line in Figure 7A (see colored labels, Jrec sampled at steps of 1 mV). Adaptation level fixed at gc = 20 mV/s. Dotted colored curves: fitted nullcline approximations at drift-dominated regime as in Figure 4A. Black dashed line: nullcline . Inset: estimated absolute refractory period τ0 versus Jrec; dashed red line, expected value. (B) Correlation between Jrec and the real part of the eigenvalues λ of the Eq. 2Jacobian, using the identified G(c,ν) around the equilibrium point ∼(1,4 Hz). Red dashed line: linear regression (p < 10−3, t-test). Green vertical line: Hopf bifurcation predicted by the linear fit. Insets: examples of ν(t) dynamics for Re(λ) < 0 (top left) and Re(λ) > 0 (bottom right) close to the equilibrium point. (C) Oscillation periods of ν(t) given by inverse Im(λ). Oscillations are damped only at the left of the Hopf bifurcation (green vertical line).

