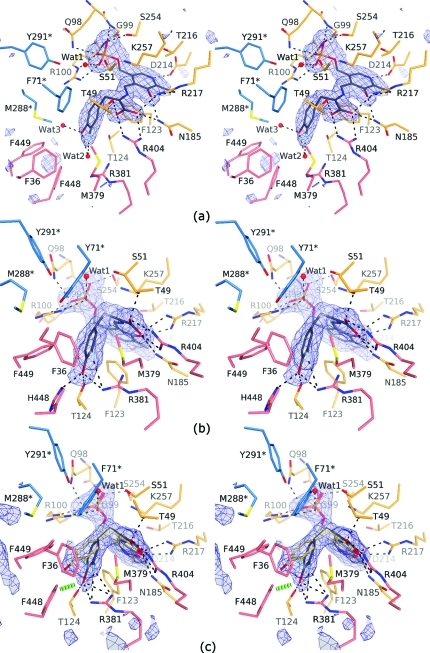
Figure 1.
Quinonoid intermediates of the Cβ–Cγ bond cleavage trapped in crystal structures (stereo views). The σA-weighted |Fo| – |Fc| omit electron density maps contoured at 3.0σ are in blue. Residues from the large domain are colored in orange, those from the small domain are in pink, and residues from the adjacent subunit are depicted in blue and labeled with an asterisk. Hydrogen bonds are denoted by dashed lines. (a) Open active site (B) of Y71F TPL with the “relaxed” 3-F-Tyr quinonoid. (b) One of the four closed active sites of F448H TPL with the “tense” 3-F-Tyr quinonoid. (c) The disordered active site (A) of Y71F TPL occupied mostly by the “tense” (gray; 0.67 occupancy) and partially by the “relaxed” 3-F-Tyr quinonoid (yellow; 0.33 occupancy). Only the closed active-site conformation could be modeled; a green hashed cylinder indicates a close contact between Phe448 and the “tense” quinonoid.

