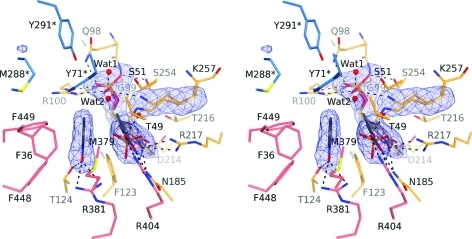
Figure 4.
Stereo view of the closed active site of the wild-type TPL with bound PNO. The σA-weighted |Fo| – |Fc| omit electron density maps are contoured at 3.0σ. Residues are colored as in Figure 1. Hydrogen bonds are denoted by dashed lines. The alanine quinonoid, the phosphate anion, and the Wat2 solvent molecule were modeled with 0.5 occupancy.

