
Figure 2.
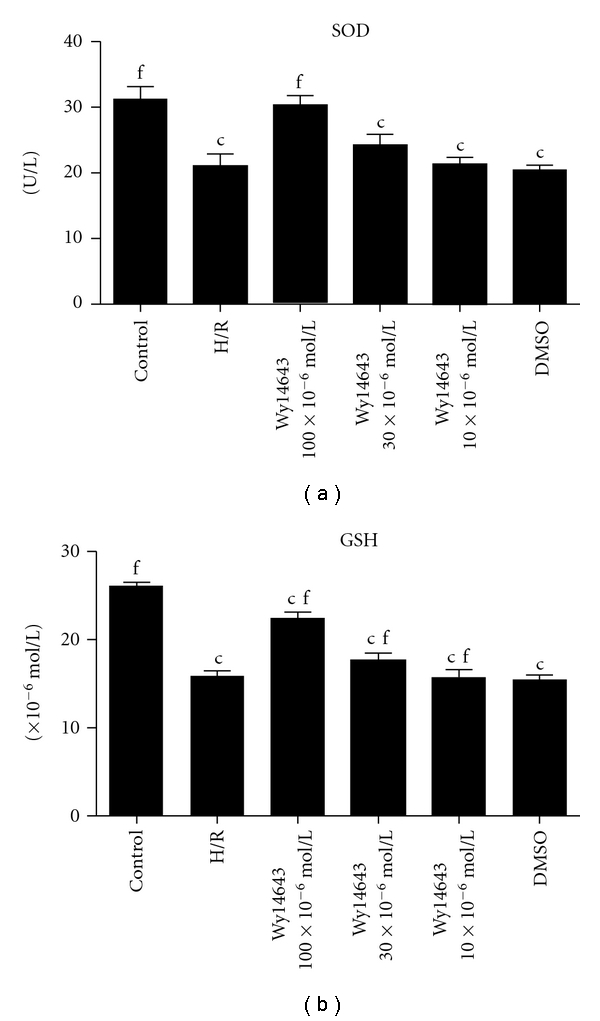
(a) SOD in different groups (Mean ± SD, n = 6). After 4 h of hepatocellular hypoxia and 10 h of reoxygenation. The levels of SOD in hepatocytes determined. c P < 0.01 versus control group; f P < 0.01 versus H/R group. (b) GSH in different groups (Mean ± SD, n = 6). After 4 h of hepatocellular hypoxia and 10 h of reoxygenation. The content of GSH in hepatocytes mitochondria fractions was determined. c P < 0.01 versus control group; f P < 0.01 versus H/R group.