
Figure 5.
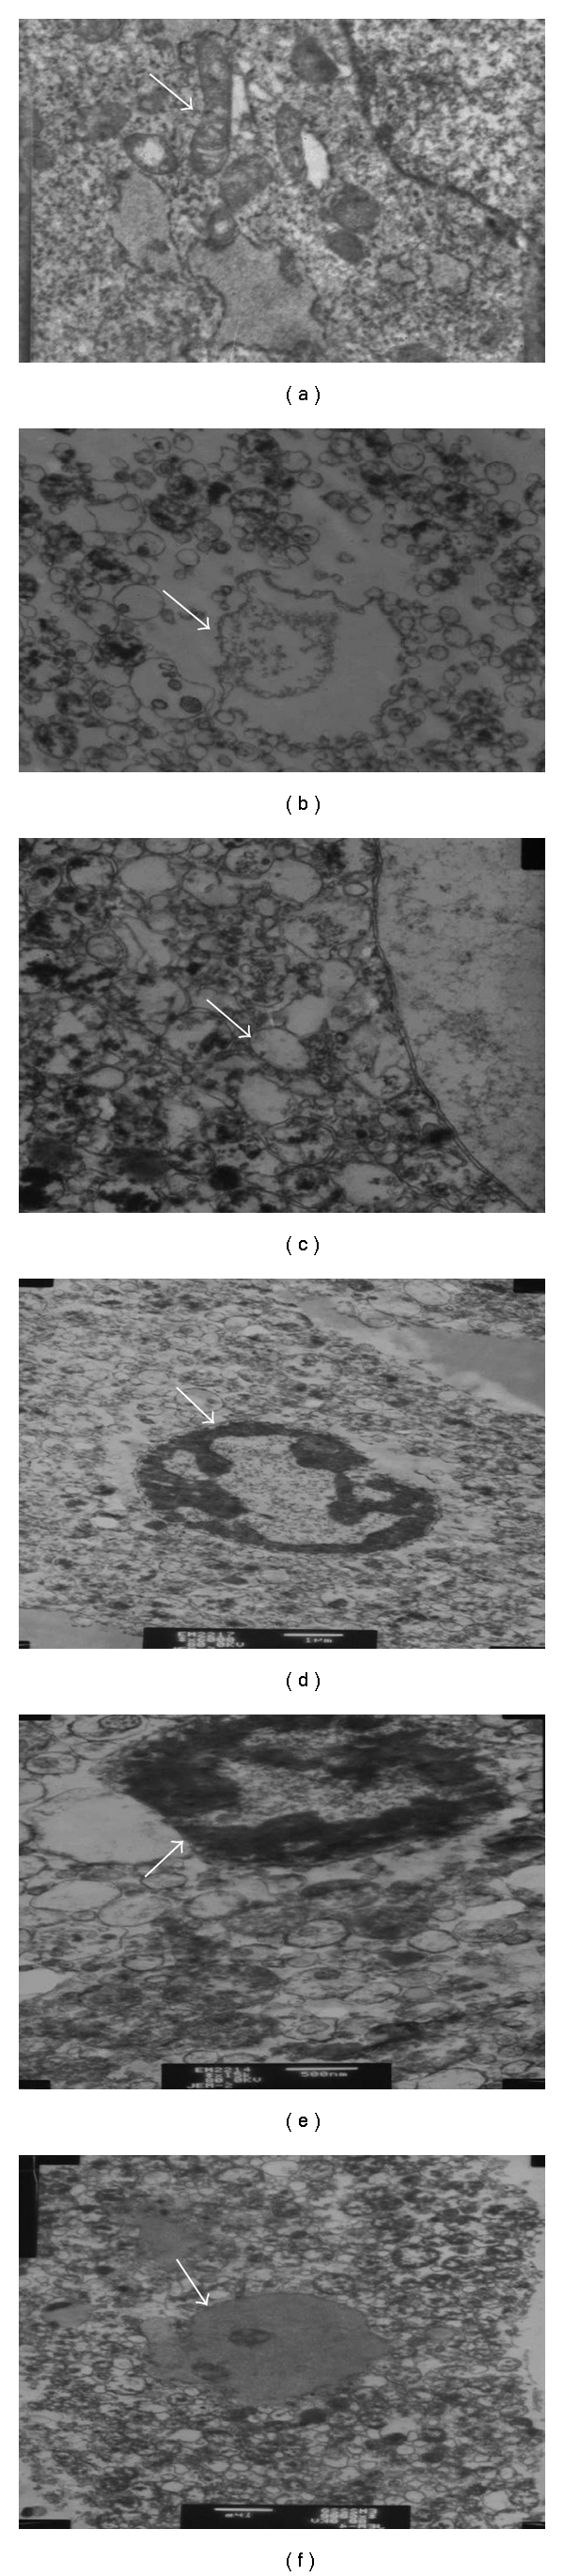
Ultrastructure alterations of hepatocytes (a) Control group, Nomal appearance of mitochondrion, nucleus struct. (X = 12 000) (b) H/R group, Mitochondrial crista destruction and nucleus structure destruction. (X = 12 000) (c) Wy14643 100 × 10−6 mol/L group, Nomal appearance of mitochondrion and nucleus structure almost. (X = 12 000) (d) Wy14643 30 × 10−6 mol/L group, Mitochondrion swellen mildly and nucleus structure are nomal nearly. (X = 12 000) (e) Wy14643 10 × 10−6 mol/L group, Mitochondrion swellen significantly, vacuolar degeneration and mitochondrial crista destruction, nucleus structure destruction. (X = 12 000) (f) DMSO group, Mitochondrion swellen significantly, vacuolar degeneration and mitochondrial crista destruction, nucleus structure destruction. (X = 12 000).