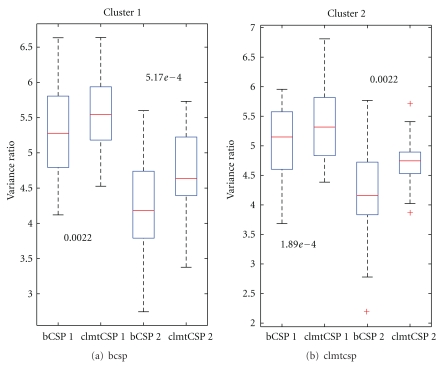
Figure 2.
(a) compares the variance ratios of the bCSP solution with the clmtCSP solution on the first cluster, while (b) makes the comparison for tasks of the second cluster. The number above or below each pair of bars is the P value according to the paired Wilcoxon signed rank test. The numeric suffix on the tick labels of the x-axis denotes the source number.

