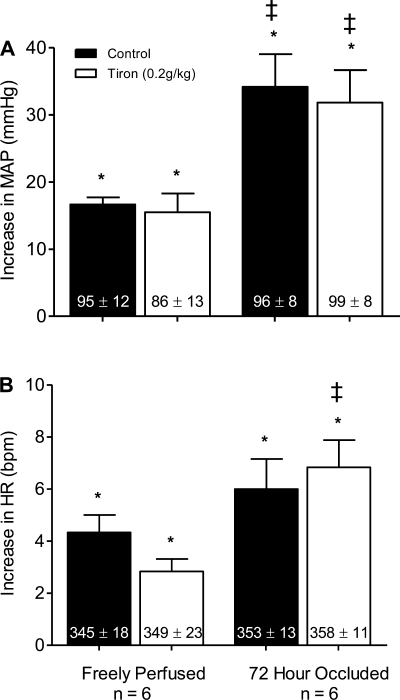
Fig. 3.
The pressor (A) and cardioaccelerator (B) responses to static contraction before (filled bars) and after intra-arterial injection of 0.2 g/kg of tiron (open bars) in rats whose hindlimbs were freely perfused and whose femoral arteries were ligated. Baseline mean arterial pressure and heart rate values are shown within vertical bars. Means ± SE. *Significant difference (P < 0.05) between baseline and peak. ‡Significant difference (P < 0.05) between freely perfused and 72-h ligated rats.

