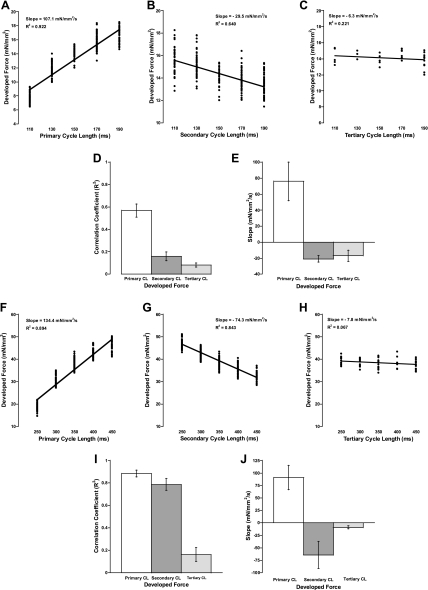
Fig. 2.
A–C and F–H: representative plots of the 3 different cycle lengths vs. developed force. A: effect of primary cycle length (all with a 150-ms secondary cycle length) in rat. B: effect of secondary (all with 150-ms primary cycle length) in rat. C: effect of tertiary (all with 150-ms secondary and tertiary cycle lengths) in rat. D: average correlation coefficient (R2) for all experiments in rat. E: average slopes of the linear fits to demonstrate that the primary cycle length correlates positively with developed force, whereas the secondary and tertiary cycle lengths correlate negatively with developed force in rat. F: effect of primary cycle length (all with a 350-ms secondary cycle length) in dog. G: effect of secondary (all with 350-ms primary cycle length) in dog. H: effect of tertiary (all with 350-ms secondary and tertiary cycle lengths) in dog. I: average correlation coefficient for all experiments in dog. J: average slopes of the linear fits to demonstrate that the primary cycle length correlates positively with developed force, whereas the secondary and tertiary cycle lengths correlate negatively with developed force in dog.

