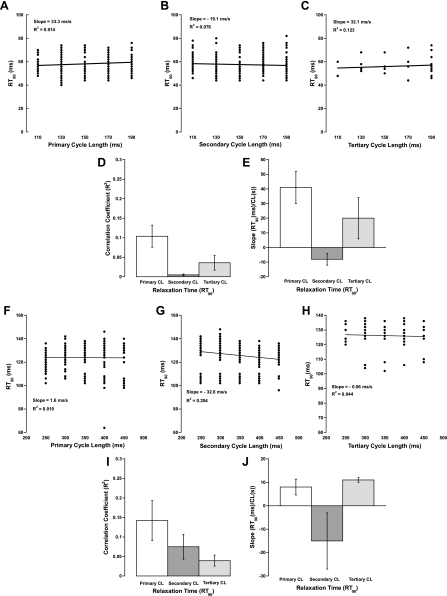
Fig. 3.
Effect of cycle length on relaxation time. A–C: representative plots of the 3 different cycle lengths vs. time from peak tension to 90% relaxation (RT90) for rat. D: average correlation coefficients of all experiments for rat. E: average slopes for all experiments in rat. F–H: representative plots of the 3 different cycle lengths vs. RT90 for dog. I: average correlation coefficients of all experiments for dog. J: average slopes for all experiments in dog.

