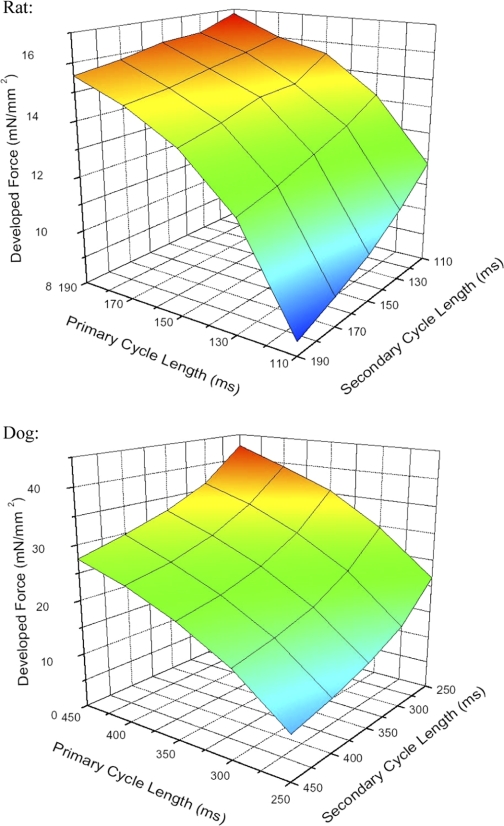
Fig. 5.
A 3-dimensional plane representation of developed force vs. primary and secondary cycle length for rat (top panel) and dog (bottom panel). From these graphs, it can be seen that a short secondary followed by a long primary renders the highest force, whereas a long secondary followed by a short primary gives the lowest force in both species.

