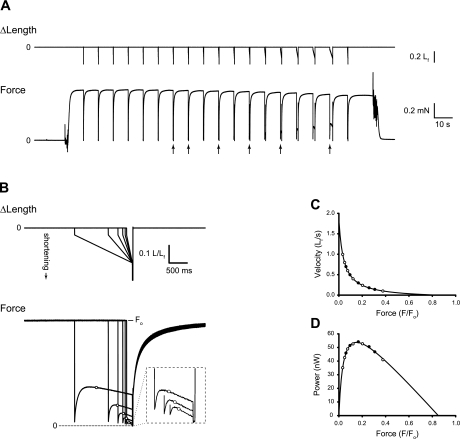
Fig. 1.
Determination of fiber force-velocity and force-power characteristics. A: step-ramp shortening movements (top) applied by means of the servomotor, and corresponding force (F) responses (bottom) for a representative type 2 (fast) fiber. Arrows beneath the force record indicate responses that are shown in greater detail in B. B: superimposed fiber length (top) and force response (bottom) records shown on expanded time scales. For clarity, only a subset of the events shown in A (see arrows) are reproduced in B. Force records have been scaled such that all have matching prerelease values. The force value associated with a given ramp velocity was recorded as fiber length passed through optimal length (Lf) during the ramp shortening, and those values are indicated with open circles on the force records. The inset replicates, on expanded scales (×4 for both time and force), the force responses to the three highest-velocity shortening ramps shown in the main figure. C: plot of the force-velocity pairs and the fitted rectangular hyperbola. D: force-power relationship obtained by multiplying force × velocity for all measured pairs and for the fitted curve shown in C. For both C and D, all measured force-velocity pairs are shown, and the open symbols indicate the subset of measurements illustrated in B. Fiber 150-2-01-12. Fo, maximum isometric force.

