Fig. 3.
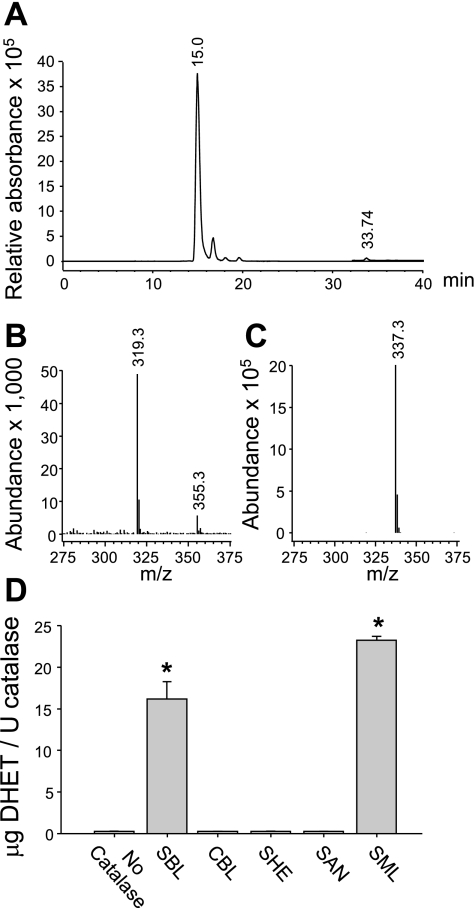
Liquid chromatography (LC)-mass spectrometric (MS) analysis of 14,15-EET metabolism by SBL catalase (A–C) and 14,15-EET hydrolysis by various commercial catalase preparations (D). 14,15-EET (10 μM) was incubated with 500 U/ml of SBL catalase for 30 min. Metabolites were extracted and analyzed by LC-MS. A: metabolite LC elution profile. B: MS [M-1] ion of the 33.74-min peak. C: MS [M-1] ion of the 15.0-min peak. D: 14,15-EET (10 μM) was incubated with the same amount of catalase activity (100 U/ml) of different catalase preparations. Metabolites were extracted and separated by reverse phase HPLC. *Significantly different from no catalase control, P < 0.05; n = 3 each.

