
Figure 4.
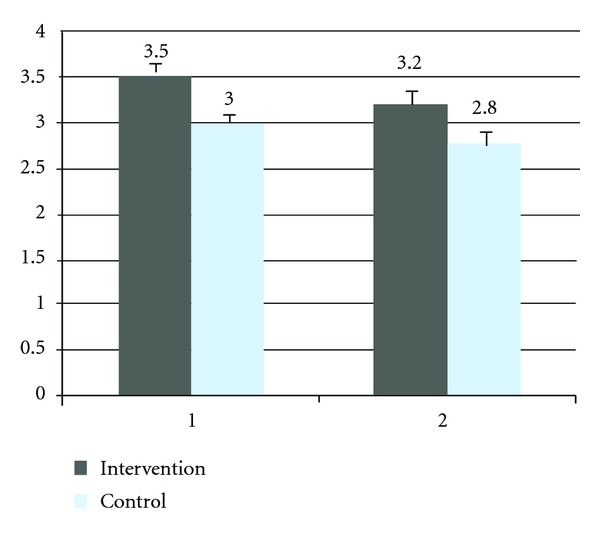
Mean modified Rankin scale score at one month and six months of the intervention and control group. 1; one month, 2; six months, mRs score range from 0 to 6, with higher scores indicating increasing severity.
Official websites use .gov
A
.gov website belongs to an official
government organization in the United States.
Secure .gov websites use HTTPS
A lock (
) or https:// means you've safely
connected to the .gov website. Share sensitive
information only on official, secure websites.
Mean modified Rankin scale score at one month and six months of the intervention and control group. 1; one month, 2; six months, mRs score range from 0 to 6, with higher scores indicating increasing severity.