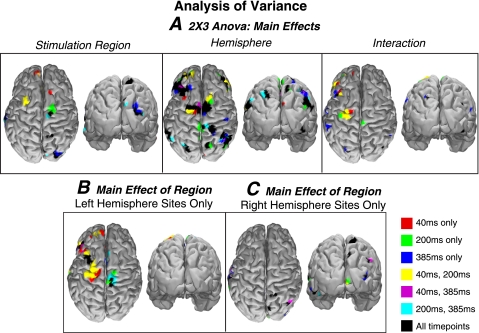
Fig. 3.
ANOVA. A: 2 (hemisphere) × 3 (regions) ANOVA of the z-scored TMS-EP at the three time points of interest in Fig. 2 (40, 200, and 385 ms) showing overlap between significant regions (P < 0.05). Both dorsal and posterior views are shown. Vertex has been excluded to include only effects within the visual networks stimulated. Inspection of the main effect of stimulation region reveals the brain regions significantly modulated by stimulation site. Regions surrounding the vertex and right occipital show significant modulations by stimulation site. A main effect of hemisphere was found in these areas as well as left/right dorsolateral prefrontal cortex, portions of parietal cortex, and occipital cortex. Left frontal/motor cortex and dorsolateral prefrontal cortex show a significant interaction between these regions. Separate one-way ANOVA only including the left hemisphere stimulation sites (B) and results for only right hemisphere stimulation (C).

