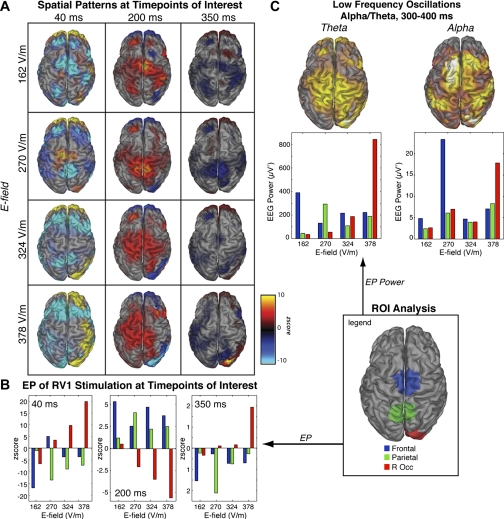
Fig. 6.
Stimulation intensity engages different cortical networks. A: spatial patterns for each stimulation intensity at the time points of interest. Different cortical networks are engaged at different stimulation intensities. B: regions of interest (ROIs) were chosen based on the spatial pattern across stimulation intensities, corresponding to an occipital region at the site of stimulation, a parietal region, and a frontal region. Evoked potential estimate within these ROIs show that some networks scale linearly (occipital, RV1 stimulation), and other regions have an optimal stimulation intensity (parietal/frontal). C: power estimates 300–400 ms after stimulation as measured by wavelet coefficients of the evoked potential.

