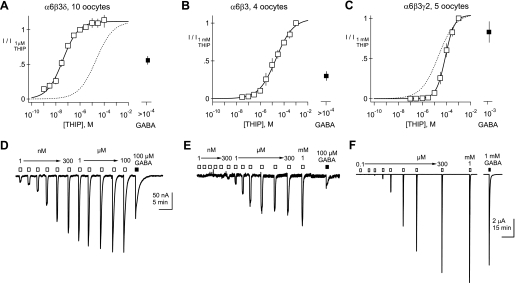
Fig. 3.
Inclusion of a δ subunit confers nanomolar THIP sensitivity. Normalized mean concentration-response curves for Xenopus oocytes injected with cRNAs encoding α6, β3, and δ (A); α6 and β3 (B); or α6, β3, and γ2 (C). EC50 and Hill slopes (h) of the solid line-fitted curves are 37 nM and 0.68, 21 μM and 0.61, and 80 μM and 1.15 for A–C, respectively. Dotted lines in panels A and C reproduce the fitted curve for α6β3. D–F: representative examples of THIP-evoked currents obtained from single Xenopus oocytes injected with α6β3δ (D); α6β3 (E); or α6β3γ2 (F). THIP and GABA applications are indicated by open and filled boxes above the traces, respectively. THIP concentrations ranging from 1 nM to 1 mM were applied as indicated, followed by a saturating concentration of GABA (100 μM or 1 mM). Scale bar in D applies to both D and E. I/I1 μM and I/I1 mM represent current at each concentration normalized to the current at 1 μM and 1 mM, repectively.

