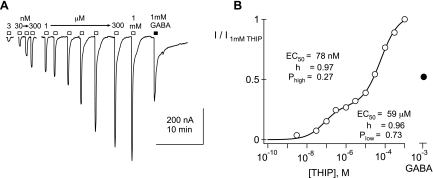
Fig. 4.
Biphasic THIP concentration-response curve from an α4β3δ-injected oocyte. A: representative THIP-evoked currents obtained from a Xenopus oocyte, injected with cRNA, encoding α4, β3, and δ. Responses to THIP concentrations of 3 nM, 30 nM, 100 nM, 300 nM, and 1–1,000 μM are shown, along with a response to a saturating concentration of GABA (1 mM). B: concentration-response plot of the THIP data in A is indicated with open circles. The filled circle shows the relative size of the current elicited by 1 mM GABA. Fit of a double-component Hill equation to the THIP data is displayed as a solid line; the fit yields the indicated parameters.

