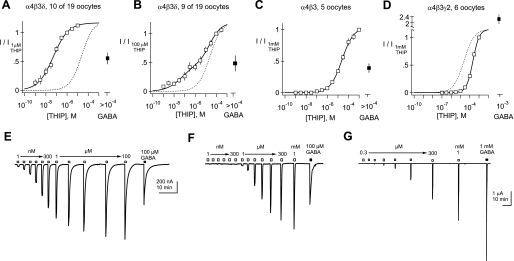
Fig. 5.
Summary of concentration-response data for THIP obtained from α4β3δ-, α4β3-, and α4β3γ2-injected oocytes. A–D: normalized mean concentration-response curves for Xenopus oocytes injected with cRNAs encoding α4, β3, and δ (A and B); α4 and β3 (C); or α4, β3, and γ2 (D). EC50 and Hill slopes of the solid line-fitted curves are A: 51 nM and 0.61; C: 24 μM and 0.79; and D: 219 μM and 1.3. A subset of oocytes injected with α4, β3, and δ was analyzed separately based on the threshold concentration generating a response and the shallowness of the concentration-response curve. B: fit with the sum of 2 Hill equations constrained to have EC50 (51 nM and 24 μM) and Hill slopes (0.61 and 0.79) obtained from the fits to A and C, with the only free parameter being the ratio of these 2 Hill components (Phigh = 0.39 and Plow = 0.61). The dotted lines (A, B, and D) are the curve from C. E–G: representative examples of THIP-evoked currents obtained from single Xenopus oocytes injected with cRNA encoding α4, β3, and δ (E); α4 and β3 (F); or α4, β3, and γ2 (G). THIP concentrations ranging from 1 nM to 1 mM, followed by a saturating concentration of GABA (100 μM or 1 mM), were tested on each oocyte.

