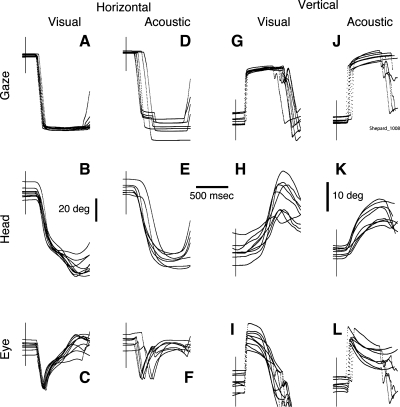
Fig. 2.
Gaze shifts to visual (A–C, G–I) and acoustic (D–F, J–L) targets in horizontal (A–F) and vertical (G–L) directions performed during a single experimental session. All traces are plotted synchronized to the onset of the target, illustrated by a thin vertical line intersecting the traces. Note the differences in variability between gaze shifts to visual and acoustic targets, particularly as it concerns the onset of the eye trace showing the effect of the vestibuloocular reflex. The horizontal scale bar is 500 ms, and the vertical bars are 20° for the horizontal data and 10° for the vertical data.

