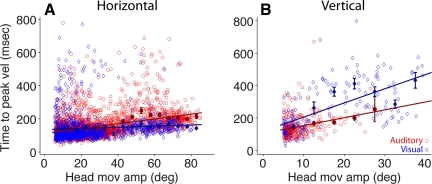
Fig. 6.
Comparison of time to peak velocity of head movements of gaze shifts to visual (blue) and acoustic (red) targets in the horizontal (A) and vertical (B) directions. Details as in Fig. 4. The coefficients of the fitted linear functions are A, visual: a = 0.351 (0.09, 0.61), b = 135 (126.5, 143.5); A, auditory: a = 1.46 (1.32, 1.6), b = 112 (106.9, 117); B, visual: a = 8.74 (6.94, 10.55), b = 118.9 (82.76, 155.1); B, auditory: a = 4.85 (3.01, 6.695), b = 105.4 (88.18, 122.6).

