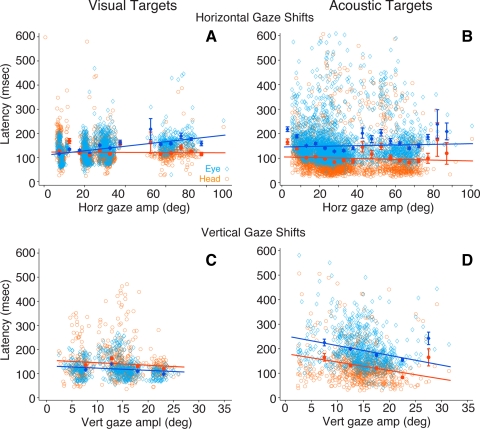
Fig. 7.
Comparison of eye and head movement latency from gaze shifts to horizontal (A and B) and vertical (C and D) visual and acoustic targets. Latency data from eye movements are plotted in light blue, and latency data from head movements are plotted in orange. Filled symbols represent binned means (5°), and standard bars represent 95% confidence intervals. The coefficients of the fitted linear functions are A, eye: a = 0.94 (0.83, 1.05), b = 108.9 (105.1, 112.8); A, head: a = −0.035 (−0.16, 0.09), b = 122.5 (118.3, 126.7); B, eye: a = 0.134 (−0.022, 0.29), b = 145.9 (140.5, 151.3); B, head: a = −0.164 (−0.304, −0.024), b = 105.6 (100.7, 110.4); C, eye: a = −1.29 (−1.89, −0.69), b = 138 (129.1, 147); C, head: a = −1.257 (−2.31, −0.21), b = 159.4 (143.8, 175); D, eye: a = −3.98 (−5.286, −2.67), b = 252.4 (231.9, 272.9); D, head: a = −3.45 (−4.699, −2.21), b = 180.2 (160.6, 199.8).

