Figure 4.
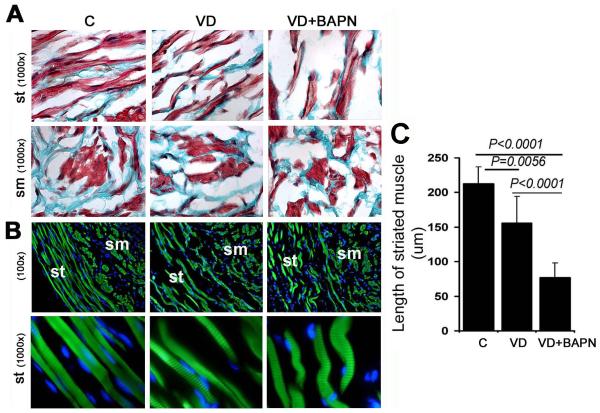
Changes in urethral muscle. A. Representative images of trichrome-stained urethral tissues of control (C), VD-treated (VD), and VD+BAPN-treated (VD+BAPN) rats. sm: smooth muscle; st: striated muscle (both stained red). B. Representative images of phalloidin-stained urethral tissues. Both smooth (sm) and striated (st) muscles stained green while cell nuclei stained blue with DAPI. Note the striation in the striated muscle fibers in the 1000× magnification. C. Compilation of quantification data. Each bar represents the average of 7 rats.

