Figure 5.
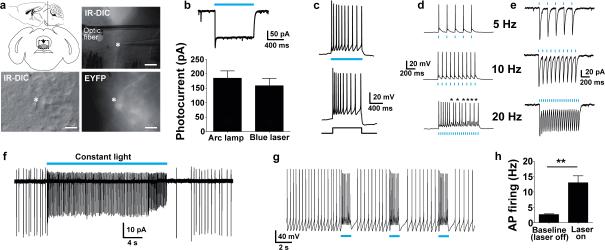
Functional characterization of TPH2-ChR2(H134R)-EYFP BAC transgenic mice. (a) Diagram of acute coronal brainstem slice preparation and representative image showing placement of the optic fiber in the region of a recorded neuron (top). Scale bar: 200 μm. IR-DIC and EYFP fluorescence image of a recorded 5-HT neuron in the dorsal raphe nucleus (bottom). Scale bar: 20 μm. (b) Voltage clamp recording of a 5-HT neuron demonstrating inward current induced by blue laser light (26.3 mW mm−2) (top). Plot of peak steady-state photocurrent in response to blue light delivered as indicated (bottom). (c) Current clamp mode recording showing action potential firing in response to blue laser light (26.3 mW mm−2) (top) or in response to +100 pA current injection (bottom). (d–e) Current clamp mode (d) and voltage clamp (e) recording of responses to patterned blue laser light (26.3 mW mm−2, 5 ms pulse width). Asterisks indicate missed action potentials. Note: in panels c–d a small hyperpolarizing current injection was applied to silence basal firing. (f, g) Cell-attached recording of a 5-HT neuron under prolonged constant blue light stimulation (f) or to repeated bouts of blue light (g). (h) Summary plot of baseline and blue light-induced firing rates. ** P < 0.01 (one-tailed paired t-test).

