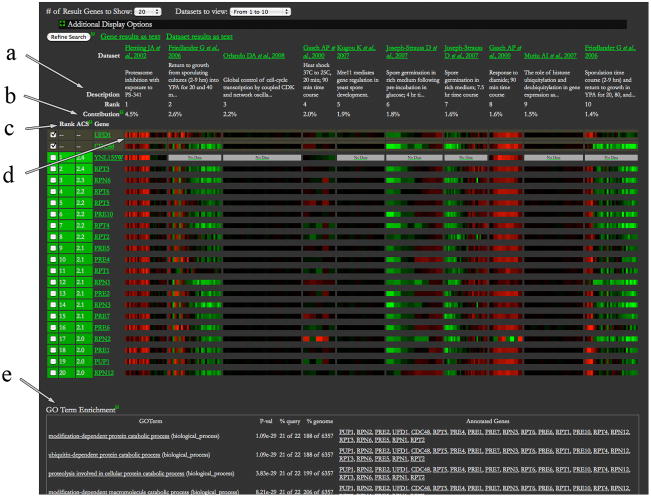
Figure 6.
SPELL Results page showing expression patterns for the top 20 genes and the top 10 datasets for the two-gene (CDC48, UFD1) query set. The arrows point to the elements of the display that are explained in the text: a) rank of datasets, b) ACS and Contribution, c) rank of genes, d) expression data as a “heat map” (red for increased, green for decreased), e) the GO Term Enrichment table (truncated for simplicity).

