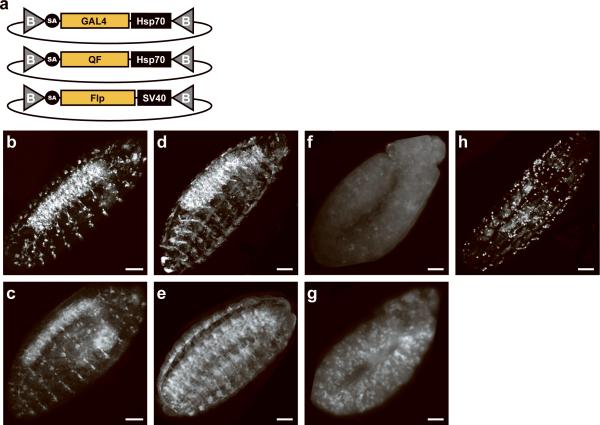
Figure 2. Binary expression and lineage analysis with MiMIC insertions.
(a) Gene-trap cassettes that incorporate the GAL4 or QF transactivators for binary activation, and the Flp recombinase for fate mapping. Live imaging (b, d) and confocal microscopy analysis using an anti-Cherry antibody (c, e) of the expression domain revealed by GAL 4 inserted in gogo (b,c ) or the caps locus (d,e). The expression domain of MYPT-75D revealed by GAL4 (f) or QF (g) integrated in MYPT-75D. Live imaging of the GAL4 expression pattern revealed by GAL4 inserted in BM-40-SPARC (h). Scale bars are 50 μm.

