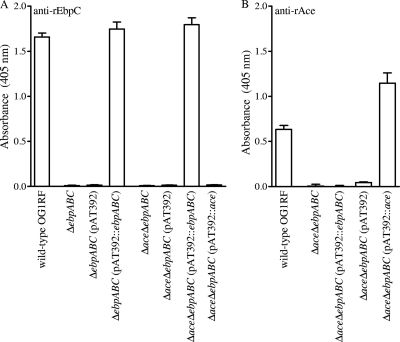
Fig. 1.
Analysis of cell surface expression of EbpC and Ace by E. faecalis OG1RF, its isogenic ΔebpABC and ΔaceΔebpABC deletion mutants, and their complementation derivatives using whole-cell ELISA. (A) Surface expression of EbpC. (B) Surface expression of Ace. BHI-S-grown cells were coated onto wells of microtiter plates, and affinity-purified anti-rEbpC and anti-rAce antibodies were used for detection of cell surface expression. Bars represent the means of absorbance at 405 nm ± standard deviations (SD) from 16 wells, representing results from three independent assays.

