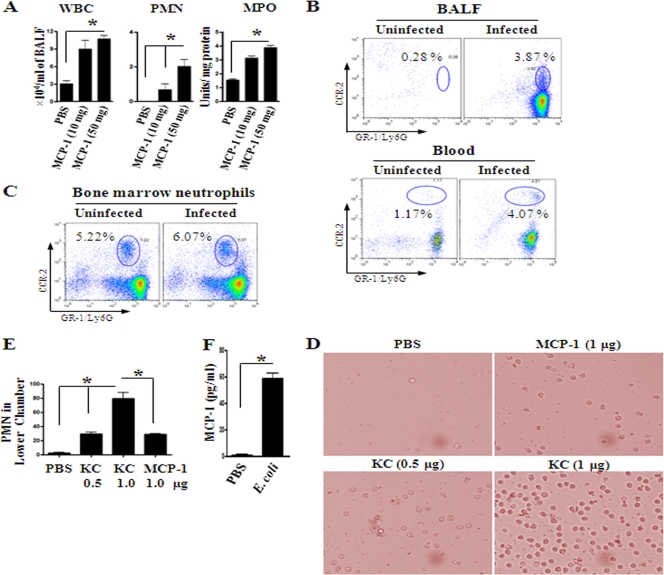
Fig. 8.
(A) Cellular recruitment into the alveoli after i.t. treatment with rMCP-1 (10 μg and 50 μg) alone. After 12 h, BALF was processed for cellular count (n = 5 to 6 mice/group; *, P < 0.005; data are a representation of 3 individual experiments). MPO, myeloperoxidase. (B) CCR2 expression in neutrophils. Flow cytometric analysis of BALF and blood from WT mice at 24 h after i.t. E. coli (1 × 10⁶ CFU/mouse) infection. Data are representative of 3 independent experiments with identical results. (D) Picture demonstrating the number of PMNs in the lower chamber of a transwell plate after incubation with chemoattractants rMCP-1 and KC. The figure is representative of 20 random fields from 3 separate experiments. (E) Chemotaxis of neutrophils toward MCP-1. PMN numbers in the lower chamber of a transwell after 3 h of incubation with rMCP-1 and KC. Data shown here are a representation of 3 individual experiments (n = 3 to 5; *, P < 0.05). (F) Bone marrow neutrophils produce MCP-1 at 2 h after E. coli infection (n = 4 to 6 mice/group from 3 separate experiments).

