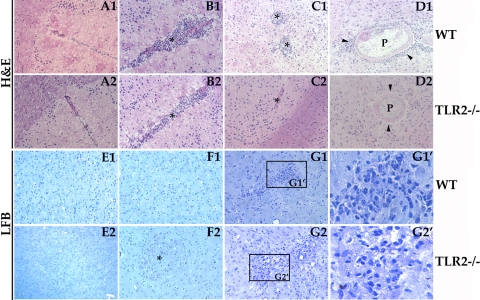
Fig. 3.
Brain pathology associated with M. corti infection in WT and TLR2−/− mice. Images show H&E staining or LFB staining of brain cryosections. (A1) H&E staining showing normal parenchymal tissue in an HBSS-inoculated WT mouse. (A2) Normal parenchymal tissue in an HBSS-inoculated TLR2−/− mouse. (B1) Indusium griseum area of the brain in a WT mouse at 3 weeks p.i. associated with large numbers of infiltrating immune cells (*). (B2) Indusium griseum in a TLR2−/− mouse at 3 weeks p.i. exhibiting a reduced number of infiltrating immune cells (*). (C1) Leukocyte cuffing in a WT mouse at 3 weeks p.i. (*). (C2) Lack of leukocyte cuffing in TLR2−/− mice at 3 weeks p.i. (*). (D1) Parenchymal parasite (P) in a WT mouse at 3 weeks p.i. associated with infiltrating immune cells (arrowheads). (D2) Parenchymal parasite (P) in a TLR2−/− mouse at 3 weeks p.i. associated with absence of infiltrating immune cells (arrowheads). LFB staining shows normal parenchymal tissue in an HBSS-inoculated WT mouse (E1) and normal parenchymal tissue in an HBSS-inoculated TLR2−/− mouse (E2). (F1) Parenchyma of WT mouse at 1 week p.i. exhibiting absence of microglial nodule formation. (F2) Parenchyma of TLR2−/− mouse at 1 week p.i. exhibiting microglial nodule formation (*). (G1) Parenchyma of a WT mouse at 3 weeks p.i. exhibiting microglial nodule formation. (G1′) Boxed area in G1 depicting microglial nodule at a magnification of ×6. (G2) Parenchyma of a TLR2−/− mouse at 3 weeks p.i. depicting increased formation of microglial nodules that are larger than those of the WT mouse. (G2′) Boxed area in G2 depicting microglial nodule at a magnification of ×6. Results are from three independent experiments. All images are at a magnification of ×200.

