Fig. 8.
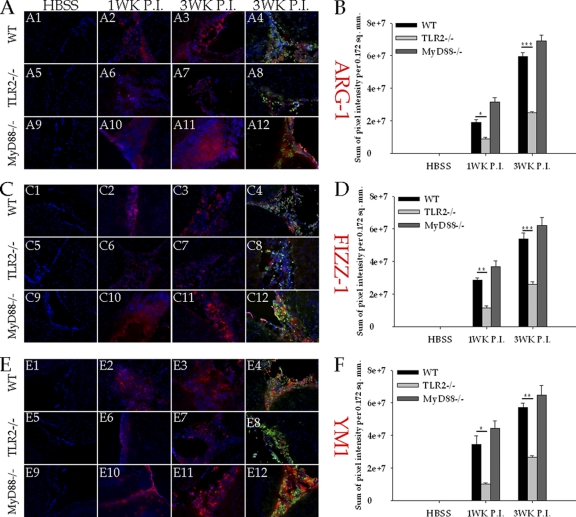
TLR2−/− mice present reduced CNS expression levels of ARG-1, Fizz1, and YM1. In situ IF staining was performed on frozen sections of mock-infected and parasite-infected brains of WT and TLR2−/− mice at 1 week and 3 weeks p.i. ARG-1, Fizz1, and YM1 expression was visualized in red (rhodamine RXX), macrophages/microglia (CD11b+) were visualized in green (Alexa Fluor 488), and nuclei were stained with DAPI (blue) (magnification, ×200). (A) ARG-1 expression in mock-infected (A1, A5, and A9), 1-week p.i. (A2, A6, and A10), and 3-week p.i. (A3, A7, and A11) brains of WT, TLR2−/−, and MyD88−/− mice ARG-1 expression at 3 weeks p.i. is colocalized with CD11b+ staining (yellow/orange) in WT (A4), TLR2−/− (A8), and MyD88−/− (A12) NCC mouse brains. (B) The relative levels of ARG-1 expression in mock- and M. corti-infected WT, TLR2−/−, or MyD88−/− animals were calculated as described in Materials and Methods. Significant differences are denoted by asterisks (*, P < 0.05; **, P < 0.005; ***, P < 0.005). (C) Fizz1 expression in mock-infected (C1, C5, and C9), 1-week p.i. (C2, C6, and C10), and 3-week p.i. (C3, C7, and C11) brains of WT, TLR2−/−, and MyD88−/− mice. Fizz1 expression at 3 weeks p.i. is colocalized with CD11b+ staining (yellow/orange) in WT (C4), TLR2−/− (C8), and MyD88−/− (C12) NCC mouse brains. (D) The relative levels of Fizz1 expression in mock- and M. corti-infected WT, TLR2−/−, or MyD88−/− animals were calculated as described in Materials and Methods. Significant differences are denoted by asterisks (*, P < 0.05; **, P < 0.005; ***, P < 0.005). (E) YM1 expression in mock-infected (E1, E5, and E9), 1-week p.i. (E2, E6, and E10), and 3-week p.i. (E3, E7, and E11) brains of WT, TLR2−/−, and MyD88−/− mice. YM1 expression at 3 weeks p.i. is colocalized with CD11b+ staining (yellow/orange) in WT (E4), TLR2−/− (E8), and MyD88−/− (E12) NCC mouse brains. (F) The relative levels of YM1 expression in mock- and M. corti-infected WT, TLR2−/−, or MyD88−/− animals were calculated as described in Materials and Methods. Significant differences are denoted by asterisks (*, P < 0.05; **, P < 0.005; ***, P < 0.005).

