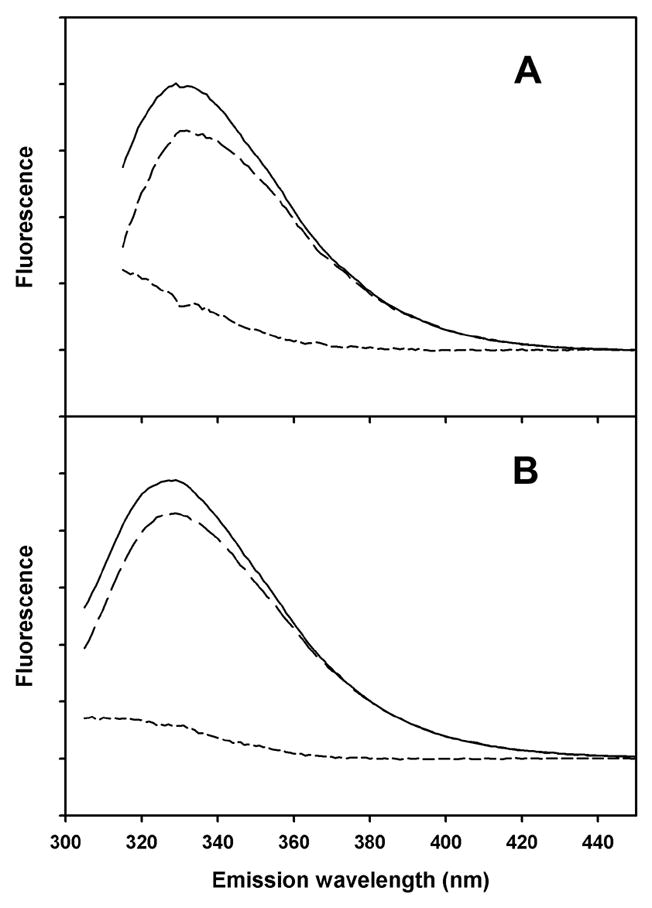
Figure 3. Fluorescence emission spectra of peptide A.

Solid lines: 280 nm excitation. Long dashed lines: 295 nm excitation, with emission scaled to same intensity in 390–400 nm region as from 280 nm excitation. Short dashed lines: difference between emission spectra from 280 nm and 295 nm excitation. A) Peptide A in small unilamellar vesicles of DOPC. B) Peptide A in SDS micelles.
