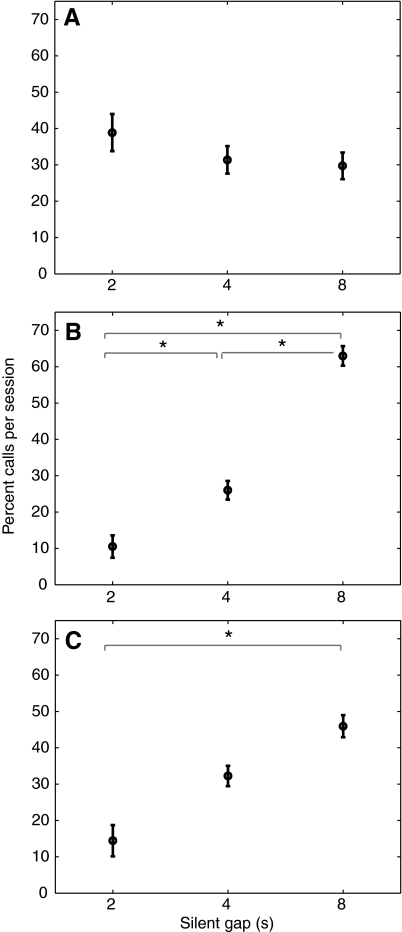
Fig. 2.
Percentage of calls initiated per session under the different noise conditions. The majority of calls in the aperiodic conditions were initiated in 4 and 8 s silent gaps. Data shown are means ± s.e.m. (N=8 subjects). Statistically significant differences with Bonferroni correction are indicated by an asterisk (*P<0.05). (A) Percentage of calls per session during the different periodic noise conditions. (B) Percentage of calls in a given predictable session initiated in 2, 4 or 8 s silent gaps. t-test results: 2 s vs 4 s (t7=3.45, P<0.017), 4 s vs 8 s (t7=6.87, P<0.001), 2 s vs 8 s (t7=9.68, P<0.001). (C) Percentage of calls in a given unpredictable session initiated in 2, 4 or 8 s silent gaps. t-test results: 2 s vs 4 s (t7=2.87, P=0.024), 4 s vs 8 s (t7=2.57, P=0.037), 2 s vs 8 s (t7=4.50, P<0.017).

