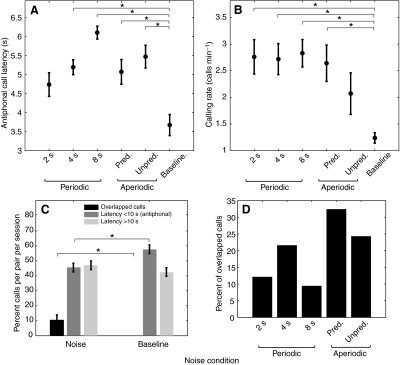
Fig. 5.
Antiphonal and individual calling parameters. Statistically significant differences between the noise and baseline are marked by an asterisk (*P<0.05). (A) Antiphonal call latencies for the different noise conditions and baseline. t-test results of the comparison of each noise condition with the baseline are: 2 s vs baseline (t7=3.16, P=0.016), 4 s vs baseline (t7=6.045, P=0.001), 8 s vs baseline (t7=7.23, P<0.001), predictable vs baseline (t7=4.453, P=0.003), and unpredictable vs baseline (t7=4.272, P=0.004). (B) Comparison of the calling rate of marmosets in the different noise conditions with the baseline. t-test results: 2 s vs baseline (t7=6.06, P=0.001), 4 s vs baseline (t7=3.756, P=0.007), 8 s vs baseline (t7=5.06, P=0.001), predictable vs baseline (t7=2.826, P=0.026), unpredictable vs baseline (t7=1.935, P=0.094). (C) Percentage of overlapped short-latency and long-latency call exchanges in noise conditions and at baseline. (D) Percentage of overlapped calls in the different noise conditions.

