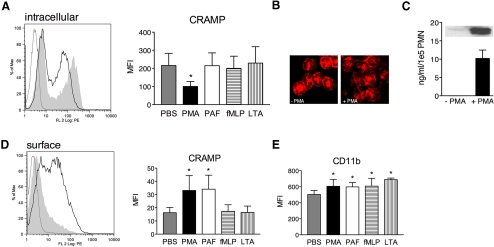
Figure 3.
Stimulation-induced intracellular decrease and surface translocation of CRAMP. (A) Flow cytometric analysis of unpurified pPMN from C57BL/6 mice stimulated for 15 min with PMA (black line) or left untreated (shaded area) and subsequently stained intracellularly with biotinylated rabbit anti-CRAMP or isotype control (gray line) antibody, followed by RPE-conjugated Streptavidin. Bar graph shows MFI of nontreated or pPMN treated with different stimuli. (B) Immunofluorescence of nontreated and PMA-stimulated bPMN stained with rabbit anti-CRAMP antibody, followed by Cy3-conjugated donkey anti-rabbit antibody. Fluorescence micrographs (original magnification, ×100) are representatives of three independent experiments. (C) Released CRAMP from bPMN nonstimulated or stimulated with PMA detected by ELISA and Western blot analysis (inset). (D) Nonpermeabilized cells stained for surface-associated CRAMP as described in A. Bar graph shows MFI of nontreated or pPMN treated with different stimuli. (E) MFI of nontreated or pPMN treated with different stimuli stained with RPE-conjugated rat anti-CD11b antibody. Representative histograms of three independent experiments are shown. Data are mean ± sd of three independent experiments with two to three mice/group. Significant differences are indicated by *, P < 0.05.

