Abstract
When a Nafion tube is immersed in water and a small hole is punched in the tube’s wall, an unexpected phenomenon occurs: Water flows continuously into the tube through the hole. The phenomenon has proved repeatable, and dynamic aspects were therefore explored, including the effects of altered pH and introduction of a second hole. It appears that the flow is closely tied to the recently discovered “exclusion zone” that forms as an annulus inside the Nafion tube. These zones generate protons in the core of the tube, which exert pressure on the menisci; once a hole is punched, the pressure is relieved by sucking water through the hole. This hypothesis is consistent with the observed experimental evidence and may be relevant to the mechanism of water transport in trees.
I. INTRODUCTION
Hydrophilic surfaces influence contiguous water in a profound way: The surface sets up a large interfacial zone that was recently shown to exclude particles and solutes [1,2]. This exclusion zone (EZ) grows on a time scale of minutes, ultimately extending to distances up to several hundred micrometers from the respective hydrophilic surface and remaining relatively stable thereafter. Recent experiments have shown that this interfacial zone is more ordered than bulk water, and that it bears a negative charge [1,2].
Many of those exclusion-zone experiments have employed Nafion, which strongly absorbs water. Dry Nafion is initially hydrophobic; however, water is progressively absorbed and as it absorbs, a film of water sticks avidly to its surface, and we have found that this film corresponds to the EZ [1,2].
During investigations of the exclusion phenomenon adjacent to Nafion tubes [3], an unexpected observation was made. A straight section of Nafion tubing was placed horizontally in a water-filled chamber, its two ends protruding from holes on either side of the chamber. The central segment was filled with water, while tube sections at either end contained air. Puncturing the wall of the submersed section brought about an immediate inward flow. The water consistently flowed through the hole into the tube, increasing the volume of water inside.
Because the energy responsible for driving this persisting flow was not immediately evident, it seemed worthwhile to explore the flow characteristics in order to understand the nature of the driving force, and to determine whether such flow might be an example of a more general flow phenomenon.
II. METHODS
A length of 3-mm-diam Nafion tubing (PermaPure TT-110, Toms River, NJ) ~7 cm long was placed in a plastic chamber 4.5 cm wide, 1.8 cm long, and 6.4 mm deep. Nafion is a Teflon-like substance with numerous sulfonate-charge groups. The tube lay horizontally in the reservoir, protruding through each of two holes drilled in opposite sides of the chamber wall. Hole diameter was carefully chosen to hold the tube securely but not allow water to escape.
A solution of distilled, de-ionized water (resistivity of 18.2 MΩ cm, Barnstead Accu-Dispense) and 2-μm carboxylate microspheres (Polysciences, Inc., Warrington, PA) was prepared using a ratio of one drop of microsphere suspension to 15 mL of water. The resulting suspension was mixed until it appeared homogeneous. The Nafion tube was placed into the empty reservoir, with ends protruding through the holes. The solution was then poured to fill the reservoir to a level 1.3 mm above the tube, and a syringe was used to fill the inside of the tube, whose ends were both left open to the air. Because of the small diameter of the tube, surface tension held the liquid inside the tube. Both the reservoir and tube were filled from the same microsphere suspension. The reservoir-Nafion-tube system was then set aside for 10–15 min to allow the exclusion zones to develop.
For puncturing the tube, a tapered needle was made using a 5-mL, 1.1-mm o.d. glass pipette (VWR, West Chester, PA) and a vertical pipette puller (David Kopf Instruments, Tujunga, CA). This device heats the glass while pulling apart both ends, resulting in two fine-tapered glass needles (~0.05-mm diam at the tip). One of these needles was placed in a micromanipulator that allowed for fine motion along all axes, and which facilitated hole puncturing.
After the tube had been immersed in the bath for 10–15 min, a hole was created midway along the length of tube by pushing the needle through the side of the tube wall until it created a hole ~0.2 mm in diameter. The needle was then slowly retracted, taking care to avoid disturbing the Nafion tube or reservoir liquid unduly, and leaving the hole open for water to pass through.
Water flow was observed by tracking the suspended microspheres under an inverted microscope (Nikon Diaphot, with Zeiss CP-Achromat magnifier and Leica DFL-290 camera) with 5× objective. We confirmed that liquid was indeed flowing into the tube by observing the continuous outward movement of the menisci inside the tube. For measurements of flow velocity we tracked microsphere movement. As the suspension had a relatively uniform microsphere density, the number of microspheres seen passing through the hole from the reservoir into the tube should be directly proportional to the volume flow, which would otherwise be difficult to measure accurately.
Larger-scale measurements including tube thickness were made using a hand caliper with an accuracy of 25 μm. Measurements of EZ size, hole diameter, and other microscopic distances were calculated by taking still photos and applying a length scale. We calibrated the scale by photographing a known distance and determining the pixel width corresponding to that distance.
III. RESULTS
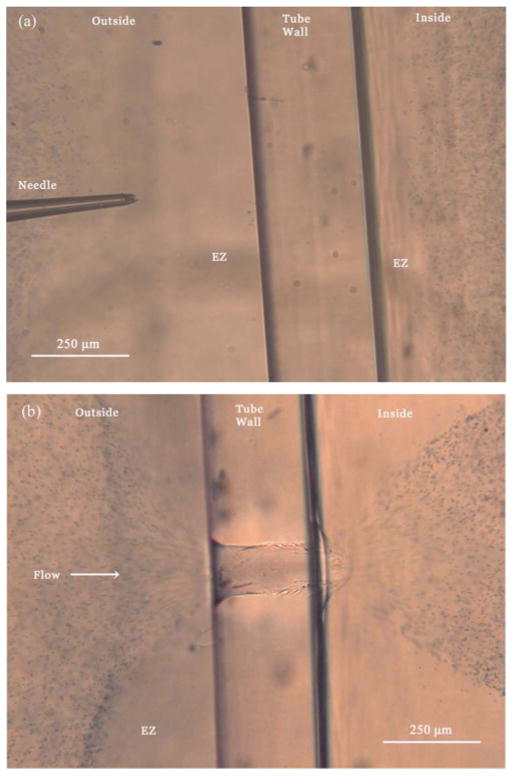
The initial result was the visual observation of a clear and consistent flow of water from the outside of the tube, through the hole, to the inside of the tube. This is illustrated in Fig. 1. The figures are representative of ten experiments each carried out identically as described earlier.
FIG. 1.
(Color online) Nafion tube (a) just before and (b) just after puncture. Views are from bottom up. The wall of the Nafion tube is shown in the center of the image, with microspheres visible as dots. The suspension flows from the outside of the tube (left) to the inside of the tube (right).
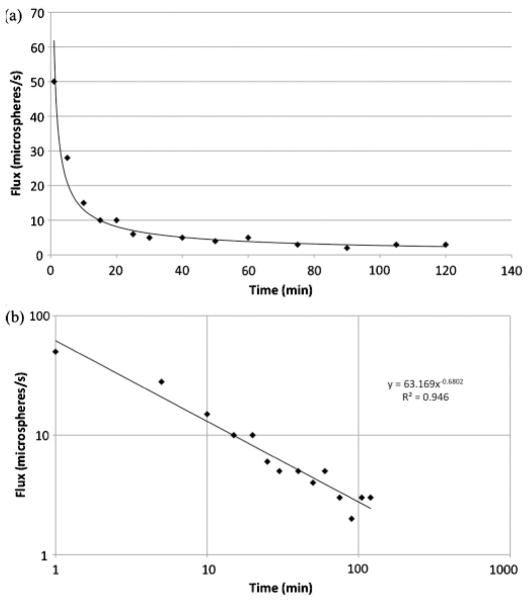
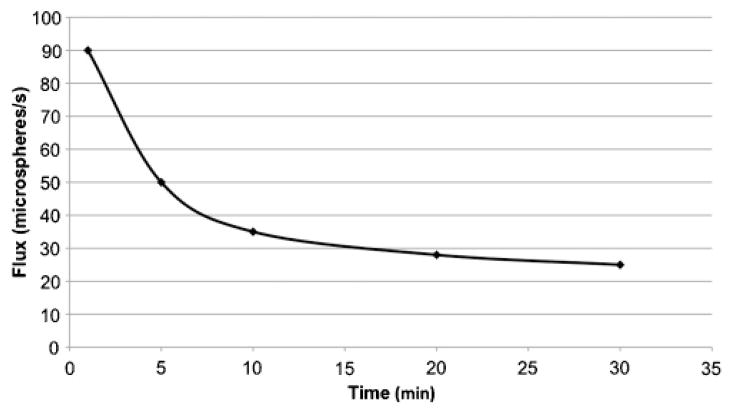
By tracking the inward motion of microspheres through the hole, it was possible to monitor the rate of flow over time. Inward flow started out strong but dropped off to lower values after tens of minutes (see Fig. 2). These lower values were sustained for several hours, with mean values of 5.7 ± 2.7 microspheres per second (n = 10 experiments). This flow persisted over a 24-hr observation time, though the rate did slowly approach zero.
FIG. 2.
Representative graph of flow rate into the tube as a function of time. (a) Ten repeated experiments showed similar characteristic decrease over time. (b) Log-log plot of same data, showing continuous decrease over time.
To check the possibility that only the microspheres, but not the microsphere suspension itself, was passing through the hole, we examined the menisci positions inside the tube as a function of time. There was a clear outward shift of both menisci starting immediately after the hole was made, indicating that the fluid, and not just the microspheres alone, flowed through the hole. Additionally, the shape of the menisci changed from concave, initially, to flat once the fluid began flowing. This change implied that it was not the menisci that were pulling, but indeed the fluid’s pressure that was pushing the menisci outward.
To check further whether capillary forces might be sucking the fluid into the tube, we eliminated the meniscus at one end, as follows. Flow was initialized and allowed to reach its near-steady rate. Once this was achieved, a syringe was used to inject additional solution into the end of the Nafion tube until the tube was completely filled so there was no meniscus. Continued observation showed no detectable change in the inward flow rate. Hence, capillary effects apparently play little role in drawing the fluid through the hole.
An additional control, to check whether the microspheres themselves might be responsible for driving the flow, was to eliminate the microspheres and use a dye. For these experiments a bolus of sodium fluorescein dye was injected outside the hole with a syringe. The dye was drawn into the tube in much the same way as the microspheres although eventual diffusion limited the general usefulness of this approach.
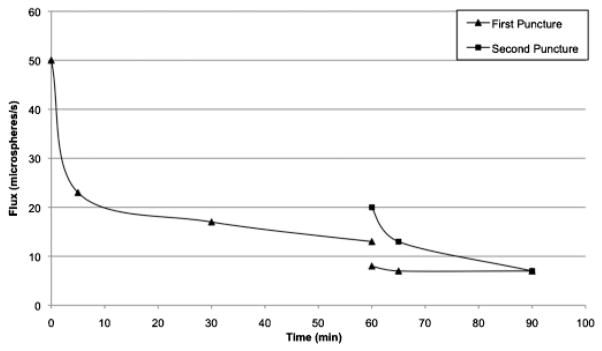
To test whether the underlying mechanism involved local effects only, we created a second hole ~1 cm away from the first. This was done ~1 hr after the first hole had been punched. We found that the flows were coupled; i.e., just as the second hole was punched, flow through the first hole abruptly diminished (Fig. 3). Meanwhile, flow through the second hole exceeded the prepuncture flow through the first hole. Both flows continued to decrease with time. This coupling implied that the flow was dependent both on local properties and characteristics of the tube system in general.
FIG. 3.
Flow as a function of time, first with a single hole and just after puncture of a second hole ~1 cm away. Representative of four experiments.
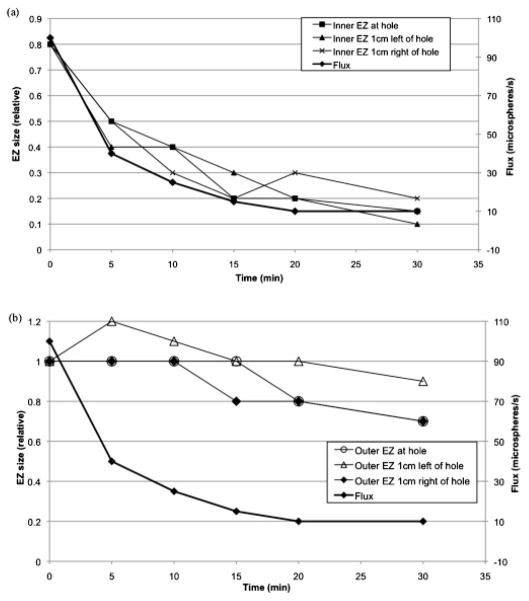
To determine whether exclusion-zone size might play a role in determining flow, we tracked inner and outer EZ sizes as a function of time, along with flow rate (Fig. 4). Outer EZ showed little variation with time; however, inner EZ did vary substantially over time: As inner EZ size shrank, flow diminished concomitantly. Representative data are shown in Fig. 4.
FIG. 4.
Flux into the tube and EZ size (a) inside and (b) outside the tube, over time. EZ size inside is tightly coupled with flow rate while EZ outside is not. Results representative of four experiments.
To test further for EZ involvement in the phenomenon, a control experiment was carried out using a Tygon tube (Cole-Parmer, Vernon Hills, IL) which exhibits no EZ. The same procedures were followed as described earlier, using a tube of similar size and diameter (i.d. 2.77 mm, wall thickness 0.86 mm). The needle produced a hole in the tube, but no flow was observed. From these observations and those of Fig. 4, we could draw two conclusions: First, the exclusion zone is likely to be a relevant factor for the presence of flow. And second, gravity-related hydrostatic pressure is not a factor in generating the flow, as the depths of the tubes that did and did not produce flow were the same.
In order to further explore the role of the exclusion zone in this flow, we studied whether flow dynamics might be impacted by induced changes in EZ size. Earlier research had shown the EZ to be negatively charged [1]. Hence, by adding H+ in the form of an acid, charge neutralization could reduce EZ size; or, by adding OH− in a base, the increased negative charge could enhance EZ size. This expectation proved accurate, and it was thus possible to test the effects of EZ size on flow rate. These tests involved creating acidic or basic suspensions, which were then substituted for the aqueous suspensions inside or outside the tube, giving four different conditions.
With a 0.01M NaOH-containing microsphere suspension introduced into the Nafion tube instead of the control suspension, the inside EZ expanded from ~0.2 to ~0.5 mm. When punctured, the inward flow was considerably greater than the control. Instead of leveling off to a rate of four to five microspheres per second, the flow leveled off at 20–25 microspheres per second (Fig. 5). Hence, increased inside EZ was associated with increased flow, again reinforcing the connection.
FIG. 5.
Water flow into the tube, with 0.01M NaOH solution inside tube. Representative of four experiments.
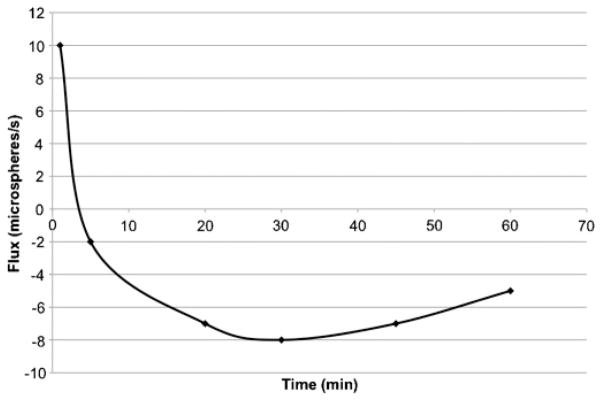
With HCl of the same concentration inside the tube, the opposite result was found—as was anticipated. The inside EZ became almost zero, compared to ~0.2 mm for the control. The flow began inward as usual, but dropped to zero by the 5-min mark. It then actually reversed direction, the outward flow increasing over the next half hour and reaching a maximum rate of 10 microspheres per second before diminishing to a slower rate (Fig. 6). Similar patterns were seen in each of six experiments, although the dynamics differed slightly.
FIG. 6.
Water flow into the tube, with 0.01M HCl microsphere suspension inside tube. Positive values indicate a flow into the tube. Representative of six experiments.
Acidic and basic solutions were also placed outside of the tube, rather than inside. With acid outside the tube, the flow behaved similarly to the NaOH-inside results: Inward flow was much higher than the control and remained at a higher steady rate relative to controls after 30–40 min. Significant complications were encountered when using NaOH outside the tube. Once the inward flow started, the microspheres began clumping together and precipitating out of the suspension. As a result, no significant data could be obtained for NaOH outside the tube.
For all of these four pH tests, we also tracked inside EZ size, as done with the original tests described earlier. Inside EZ consistently decreased with time, as was the case with controls.
From all of these observations we began formulating a hypothesis that could account for all of the results, which we discuss below.
IV. DISCUSSION
An unexpected flow pattern was explored in these experiments, apparently related to the presence of a so-called exclusion zone [1,4]. When a Nafion tube was immersed in water and a hole was punched in the tube wall, the water flowed continuously from the outside to the inside of the tube. Although the flow rate diminished with time, it persisted for at least the full period of observation, which typically exceeded 1 hr. And, it was observable in every one of the approximately 40 experiments carried out.
Nafion is a Teflon-like material containing numerous sulfonate-charge groups, which make it hydrophilic. When a water droplet is placed on dry Nafion, the contact angle implies that the surface is hydrophobic; however, with time the Nafion absorbs water, which makes it hydrophilic. In fact, Nafion is so water loving that it is used commonly as a drying agent. We found recently that Nafion, as well as numerous other hydrophilic substances, build large hydration zones on their surfaces, which we have termed “exclusion zones” because of their propensity to exclude particles and solutes [2]. These zones are generally negatively charged, whereas the zones beyond them are commensurately positively charged, and the charge separation is apparently driven by incident infrared energy [4].
Control experiments demonstrated that the observed flow was neither the result of some kind of capillary effect nor the result of a hydrostatic pressure differential, but was specific to some intrinsic feature of the tubing. Silicon tubing is hydrophobic, and shows no such zones and no flow. Hence, it appeared that some feature of Nafion’s EZ-generating capacity might be responsible for inducing this flow.
We confirmed that flow rate depended on the size of the annular EZ inside the tubing. Increasing EZ size by adding base within the tubing increased flow magnitude, while diminishing inside EZ size by adding acid inside diminished the flow. We also found that dynamic changes of EZ size correlated with dynamic changes of flow. Hence, the evidence implied that some aspect of inside-EZ size might be responsible for driving the flow.
The driving mechanism may involve the charge separation mentioned previously. The EZ is negatively charged [1], while the region beyond the EZ is positively charged as a result of protons released into that zone [4]. The protons would be expected to combine immediately with water, creating hydronium ions, i.e., positively charged water. They would effectively constitute positively charged water molecules exerting pressure inside the tube.
To confirm whether protons were being created, as anticipated, we imposed flow through the tube and collected the exiting water. We examined 8-cm lengths of tubing. Most of the exiting water was from the core of the tube, the annular EZ zone being more tightly held to the Nafion wall [3]. At a flow rate of 0.3 mL/min, we found that relative to the input pH, the output pH diminished by 1.11 ± 1.04 units by 15 min and 1.24 ± 0.36 units after 30 min. Hence, protons were created inside the tube over time, as anticipated.
Thus, a possible reason for the flow stems from the pressure exerted by hydronium ions. By the time of the puncture, the positive charge concentration inside the tube will have grown appreciably. While the corresponding negative charge is in the EZ annulus, which is secured to the inside of the tube, the hydronium ions are free, and thus able to exert positive pressure. Although the pressure is exerted throughout the tube, only the menisci are free to move easily. However, they cannot displace because the cohesiveness of the water molecules inside the tube prevents much displacement.
Once the hole is punched, however, the situation changes dramatically. Then, the menisci can move outward by sucking fluid through the hole. The fact that the menisci flatten during the movement is a sign of uniform force pushing on the meniscus.
In theory, the pressure could drive the menisci outward as suggested; or, it could drive fluid out of the hole, dragging the menisci inward. Menisci cross sections are four orders of magnitude larger than that of the hole; hence, they offer much less resistance. Therefore the internal pressure drives them outward, sucking the water into the tube as a result. We did find instances when the flow could be reversed: when the inside EZ was obliterated by the addition of acid—and presumably no protons were created—then the flow did reverse over time (Fig. 6).
Several observations are consistent with this hypothesis. First, agents that increased the inside EZ, and hence the inside proton concentration, increased the flow, whereas agents that decreased the inside EZ and proton concentration decreased the flow. Second, to the extent we could assess, agents acting on the outside EZ had little effect on the flow. That is also anticipated. Third, punching a second hole is expected to reduce inflow resistance and therefore allow for larger flow, and that was observed as well.
A question is why the flow generally decreases with time. One possibility derives from the nature of the water entering through the hole. This water comes from regions close to the external EZ, and should therefore be rich with protons. Influx of protons into the tube effectively acts to neutralize the negatively charged EZ, diminishing internal EZ size; such time-dependent decrease was observed. The diminished EZ should in turn generate fewer protons. This negative feedback cycle might then lead to exponentially diminishing flows. More extensive measurements will be needed to determine whether this explanation suffices.
While the proposed mechanism seems generally consistent with observations, additional experiments will be required to test its detailed features and predictions. The main purpose here is to report this unexpected but consistently observed flow, and to speculate on the possible driving force.
An interesting feature of the experiment is its similarity to flow in xylem. Xylem tubes made of long hydrophilic conduits carry water from roots to the tops of plants and trees. The mechanism of transport has remained a mystery, especially the ability to transport water to heights as much as 100 m [5]. If the mechanism hypothesized here is adequate, then similar processes might take place inside of xylem tubes; hence hydronium-ion pressure might be responsible for driving fluid upward in xylem tubes.
Implicit in this persisting flow is some source of driving energy. Flow persists for extended lengths of time, well beyond 1 hr; hence some continuous source of driving energy is implied. If the proposed charge-based mechanism turns out to be adequate, then a likely energetic source is incident radiant energy, for radiant energy fuels EZ buildup [4]. This energy would drive charge separation and hence create the pressure responsible for the persisting flow. Hence, incident electromagnetic energy might be the ultimate driving source for this counterintuitive flow in much the same way that incident electromagnetic energy is an energy source for plants and single-celled organisms. This energy hypothesis remains to be explored.
References
- 1.Zheng JM, Pollack GH. Phys Rev E. 2003;68:031408. doi: 10.1103/PhysRevE.68.031408. [DOI] [PubMed] [Google Scholar]
- 2.Zheng JM, Chin WC, Khijniak E, Khijniak E, Jr, Pollack GH. Adv Colloid Interface Sci. 2006;127:19. doi: 10.1016/j.cis.2006.07.002. [DOI] [PubMed] [Google Scholar]
- 3.Klyuzhin I, Symonds A, Magula J, Pollack GH. Environ Sci Technol. 2008;42:6160. doi: 10.1021/es703159q. [DOI] [PubMed] [Google Scholar]
- 4.Chai B, Yoo H, Pollack GH. J Phys Chem B. 2009;113:13953. doi: 10.1021/jp908163w. [DOI] [PMC free article] [PubMed] [Google Scholar]
- 5.Canny M. Am Sci. 1995;86:152. [Google Scholar]


