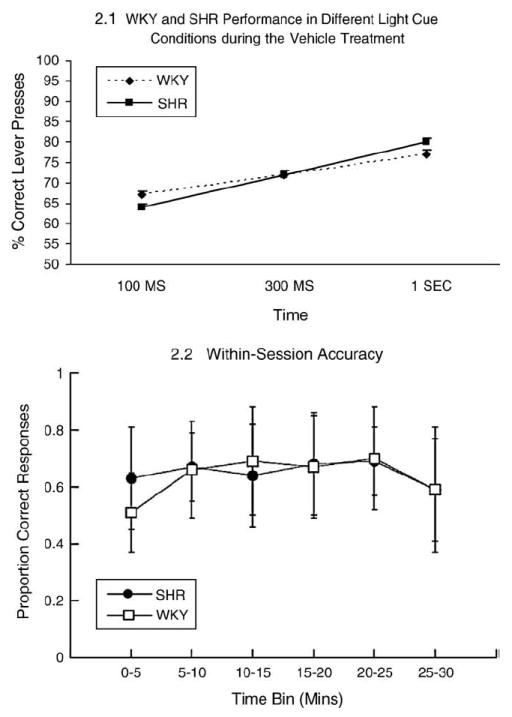
Fig. 2.

(2.1)WKY and SHR performance in different light cue conditions during the vehicle treatment. The three light cues (100 ms, 300 ms, 1 s) are shown on the X axis and the percent correct responses are shown on the Y axis. The two line graphs represent the choice accuracy for SHR and WKY rats as a function of stimulus cue duration. No difference was evident between the groups in the baseline condition. (2.2) Within-session data comparing SHR and WKY rats at the 100 ms signal for the saline treatment session prior to drug treatment. A slight warm-up effect and end-of-session drop off effect is revealed, but no differential accuracy between the two groups at the final session blocks, as might be predicted if the two groups differed in vigilance or fatigue.
