Fig. 4.

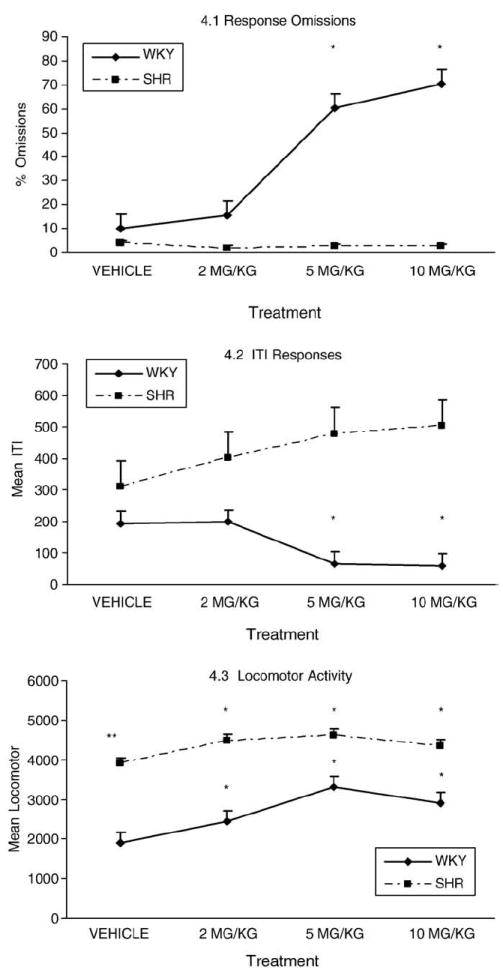
Behavioral measures for WKY and SHR with different treatments. 4.1. Response omissions. The four dose treatments (vehicle, 2 mg/kg, 5 mg/kg, 10,g/kg) are shown on the X axis. The percent omissions are shown on the Y axis. MP treatments with 5 mg/kg and 10 mg/kg produced marked increase in response omissions for the WKY rats but not for the SHR rats. Due to the fact that the omission curves for each strain were very similar across light cue conditions, the four treatments were collapsed in a single line graph for each strain. 4.2. ITI responses. The four dose treatments (vehicle, 2 mg/kg, 5 mg/kg, 10 mg/kg) are shown on the X axis. The ITI responses are shown on the Y axis. The MP treatments with 5 mg/kg and 10 mg/kg produced significant decreases in non-reinforced ITI responses for the WKY rats and non-significant increase for the SHR rats. 4.3. Locomotor activity. The four dose treatments (vehicle, 2 mg/kg, 5 mg/kg, 10,g/kg of MP) are shown on the X axis. The locomotion measures are shown on the Y axis. MP treatments magnified the baseline activity difference between the two stains represented by the line graphs for the WKY and the SHR rats.
* Annotates significant change from performance in vehicle condition
** Annotates significant difference between locomotor activity between WKY and SHR vehicle condition
