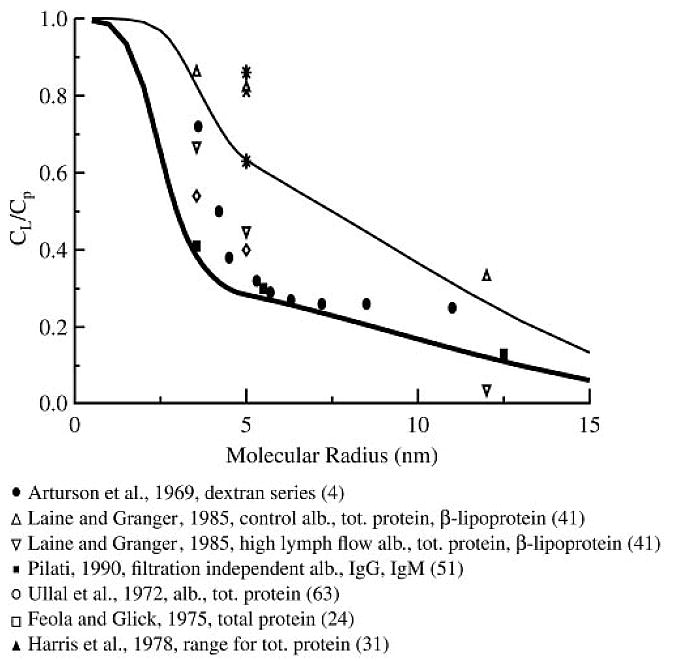
Fig. 6.

Steady-state lymph-to-plasma concentration ratio (CL/Cp) values predicted by the model for control conditions (thin line) and at filtration rate independence (thick line) compared with a compilation of experimental data in mammalian cardiac tissue. Parameter values are from Table 1. P, σ, and γ are functions of molecular size and diffusion coefficient given by Eq. 32, 46, and 47; D was assumed proportional to 1/rs. Pilati's data are the most definitive; the other data were acquired and partially flow-limited conditions.
