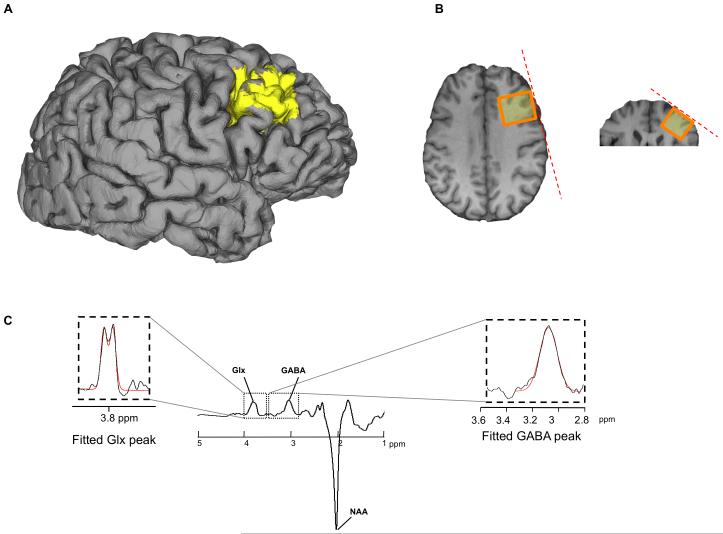
Figure 1.
Methodology for spectroscopy. (a, b) the MRS voxel (yellow, 3 cm × 3cm × 3cm voxel) was placed over the anatomical location of the dlPFC. Edited MR spectra (c) allow the quantification of GABA concentration by extracting the area under the GABA peak (39-41, 68). In a similar way, we extracted a measure of glutamate+glutamine, Glx, (also marked is the N-acetyl-aspartate peak, NAA). The GABA peak will contain signal from co-edited macromolecules, but although we do not know the exact contribution, we do not expect any individual differences in macromolecules to drive any correlation with our behavioural measures.

