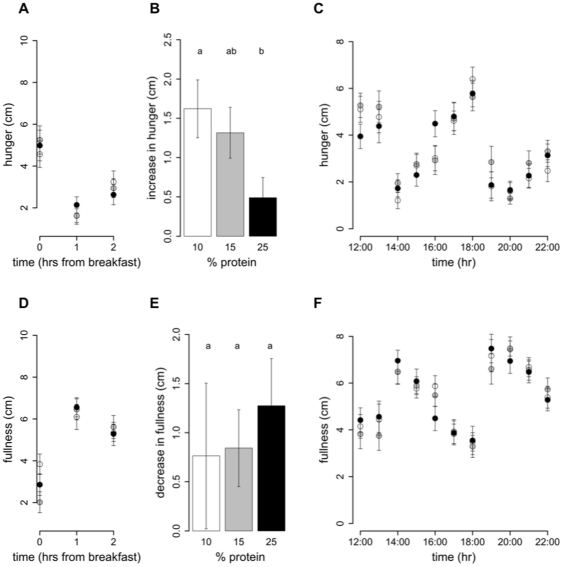
Figure 3. Hunger and fullness scores on 10%, 15% and 25% protein diets.
On study day 4, subjects completed a visual analogue scale (VAS) questionnaire to assess subjective hunger and fullness. The VAS questionnaire asked subjects to assess their hunger by reference to a 10 cm horizontal line anchored at one end with the extreme feeling “not at all hungry” and at the other end with “very hungry” and fullness with the extreme feeling “not at all full” and at the other end “very full”. This was done hourly from before breakfast until 10pm. Participants were free to consume breakfast anytime between 08:00–10:00, after which lunch and dinner times were fixed. Hunger and fullness curves have been plotted accordingly. The score prior to breakfast (first of the day) and the 2 scores following breakfast were plotted for hunger (A) and fullness (D). From 12:00 onwards scores for hunger (B) and fullness (D) were plotted on the hour. Figures 3 C and F show the increase in hunger and decrease in fullness from 1 to 2 h following breakfast. Bars with different letters are significantly different (P<0.05) with Bonferroni post hoc comparisons.

