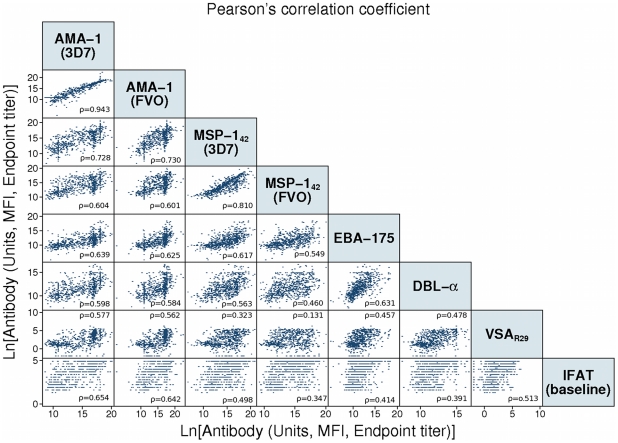
Figure 3. Correlation of antibody responses to merozoite and VSA antigens within the individual.
A matrix of log-transformed antibody units or mean fluorescence intensities (VSAR29) against the selected blood stage antigens shows correlation of antibody responses between antigens. Pearson's correlation coefficient (ρ) is included in each antibody combination panel (p-value<0.001 for all correlations).

