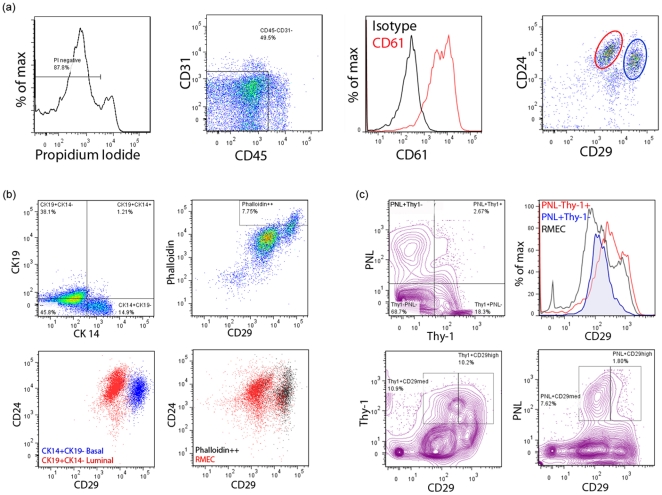
Figure 1. Characterization of rat mammary epithelial cells (RMECs) based on cell surface and intracellular markers.
(A) Representative flow cytometric histograms and dot plots showing gating for propidium iodide (PI)-negative (live) cells (left panel); exclusion of endothelial cells and leukocytes based on CD31 and CD45 expression, respectively (middle left panel); CD61 expression in CD45–CD31– RMECs (middle right panel); CD24 and CD29 expression in CD45–CD31– RMECs identifies two major populations indicated with a red or blue circle (right panel). (B) Dot plots of intracellular cytokeratin (CK) 14 and CK19 expression in CD45–CD31– RMECs (upper left panel); intracellular smooth muscle actin (SMA) staining with phalloidin and CD29 expression in CD45–CD31– RMECs (upper right panel); overlay of dot plots showing CD24 and CD29 expression in CK14+CK19- cells and CK19+CK14- cells (lower left panel); overlay of dot plots of phalloidin bright cells on CD24 and CD29 expression in CD45–CD31– RMECs (lower right panel). Based on CK14, CK19, and SMA expression, the luminal (red) and basal (blue) populations in CD45–CD31– RMECs are identified. (C) Contour plot showing binding of Peanut Lectin (PNL) or anti-Thy-1 in CD45–CD31– RMECs (left panel), overlaid histograms showing CD29 expression on PNL+Thy1-, PNL-Thy-1+ cells (middle left panel), contour plots showing anti-Thy-1 (middle right panel) or PNL binding in CD29med or CD29hi cells (right panel). For all panels, rats of 12 weeks of age were used.

