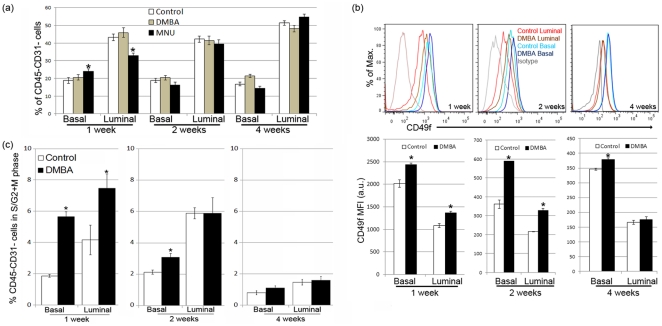
Figure 3. Modulation of RMEC differentiation by exposure of the rats to 7,12-dimethylbenz(a)anthracene (DMBA) or N-methyl-N-nitrosourea (MNU).
(A) Mean ± sem percentage of basal and luminal RMEC populations in age-matched untreated control, DMBA-treated, or MNU-treated rats at 1, 2, and 4 weeks after treatment. 1 week: control n = 21, DMBA n = 7, MNU n = 12; 2 weeks: control n = 18, DMBA n = 9, MNU n = 10; 4 weeks: control n = 24, DMBA n = 10, MNU n = 12. A significantly different percentage as compared to the age-matched control group is indicated with an asterisk (p<0.05). (B) Representative overlaid histograms (upper panels) showing upregulation of CD49f expression in basal and luminal cells following DMBA treatment; bar graphs (lower panels) quantifying mean fluoresence intensity (MFI) in artificial units (a.u.) ± sem of CD49f in basal and luminal RMECs from rats 1, 2 or 4 weeks after DMBA treatment as compared to age-matched untreated control rats. 1 week: control n = 6, DMBA n = 6; 2 weeks: control n = 6, DMBA n = 6; 4 weeks: control n = 9, DMBA n = 7. Significantly different MFI comparing the DMBA group to the control group is indicated with an asterisk (p<0.05). (C) Bar graphs showing the mean ± sem percentage of RMECs containing >2n cellular DNA (dividing cells in S/G2+M phase of cell cycle) in age-matched untreated control or DMBA-treated rats 1, 2, and 4 weeks after treatment. A significantly different percentage comparing the DMBA group to the control group is indicated with an asterisk (p<0.05).

