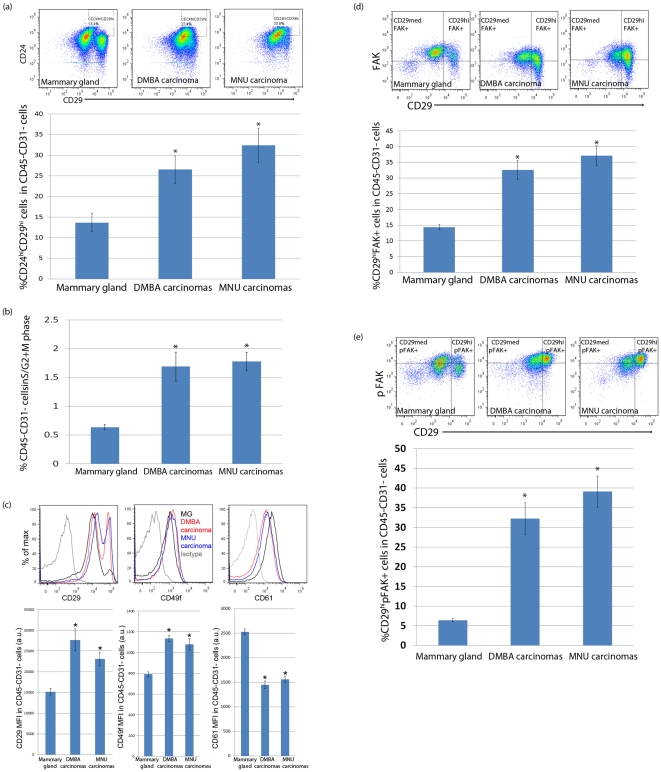
Figure 4. Differences between the RMECs from mammary glands of untreated control rats and mammary carcinomas from rats exposed to 7,12-dimethylbenz(a)anthracene (DMBA) or N-methyl-N-nitrosourea (MNU).
(A) Representative pseudo-color dot plots showing CD24 and CD29 expression in the RMECs from the mammary gland of an age-matched (22 weeks of age) untreated control rat (upper left panel) and a DMBA- (upper middle panel) or MNU-induced (upper right panel) carcinoma; bar graphs (lower panel) quantifying mean ± sem percentage cells in the CD24hiD29hi gate within the total (CD45–CD31–) RMECs. A significantly different percentage comparing carcinomas to mammary glands is indicated with an asterisk (p<0.05). (B) Bar graphs showing the mean ± sem percentage of RMECs containing >2n cellular DNA (actively dividing cells in S/G2+M phase of cell cycle). Significantly different percentage comparing RMECs from carcinomas to control mammary glands is indicated with an asterisk (p<0.05). (C) Representative overlaid histograms showing upregulation of CD29 expression (upper left panel), upregulation of CD49f expression (upper middle panel) and downregulation of CD61 expression (upper right panel) in RMECs of a DMBA-induced or MNU-induced carcinoma as compared to a control mammary gland; bar graphs quantifying the mean fluorescence intensity (MFI) in artificial units (a.u.) ± sem of CD29 (lower left panel), CD49f (lower middle panel) and CD61 (lower right panel) on RMECs from control mammary glands and carcinomas. Significantly different MFI is indicated with an asterisk (p<0.05). (D) Representative pseudo-color dot plot showing gating for CD29 and focal adhesion kinase (FAK) in RMECs from a control mammary gland (upper left panel), a DMBA-induced (upper middle panel) and MNU-induced (upper right panel) carcinoma; bar graph (lower panel) quantifying mean ± sem percentage of CD29hiFAK+ cells. A significantly different percentage comparing carcinomas to control mammary glands is indicated with an asterisk (p<0.05). (E) Representative pseudo-color dot plot showing gating for CD29 and Y397-phosphorylated focal adhesion kinase (pFAK) in RMECs from a control mammary gland (upper left panel), a DMBA-induced (upper middle panel) and MNU-induced (upper right panel) carcinoma; bar graph (lower panel) quantifying mean ± sem percentage of CD29hi pFAK+ cells. A significantly different percentage comparing carcinomas to control mammary glands is indicated with an asterisk (p<0.05). In the entire figure 4, age-matched untreated control mammary glands: n = 16, DMBA-induced mammary carcinomas: n = 10 and MNU-induced mammary carcinomas: n = 10.

