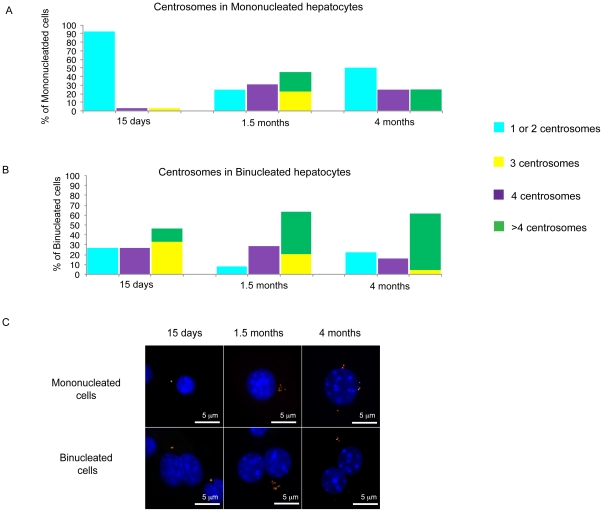
Figure 3. Centrosome analysis.
(A, B). The plots summarize the percentage of mononucleated (A) and binucleated cells (B) classified according to the number of centrosomes found by co-immunostaining with anti γ-tubulin and anti-pericentrin. In this plotting the percentage of cells with 4 centrosomes is kept separate from cells carrying 1 and 2 centrosomes since, depending upon the DNA content, cells with 4 centrosomes could be classified as normal or abnormal. (C) Examples of normal and extranumerary centrosomes detected by colocalization of γ-tubulin (green) and pericentrin (red) in mono (top) and binucleated (bottom) hepatocytes for the different ages analyzed. For the older mice analyzed some example of extra-centrosomes are reported.

